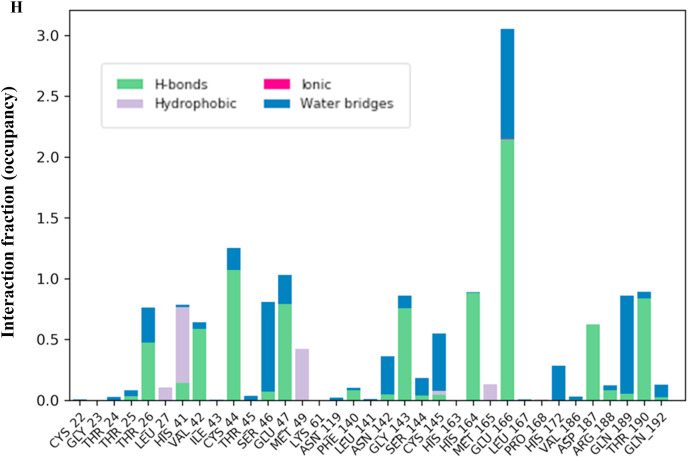
Fig. 2h.
Interaction fraction (occupancy) plot of main protease with theaflavin digallate. Y-axis represents the total number of contact fractions per residue per simulation time, i.e., if the residue (presented on X-axis) has one contact during the whole simulation of 200 ns, it will have an interaction fraction score of 1. Glu166 has a score of ∼3, representing Glu 166 retains at least three total contacts during the whole simulation.

