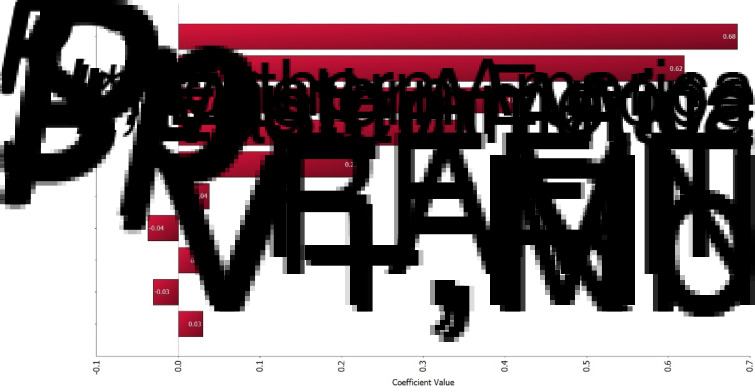
Fig. 4.
Tornado graph illustrating the results of sensitivity analysis. All model input parameters are ranked by Spearman's correlation coefficient according to their contributions to the variance of model output Yworldwide. The 10 most correlated input parameters are shown in this figure. The top-five most correlated parameters include PV+,Nb, SpRFFIT PV+,Rb, PV+,Md and SpFAVN.

