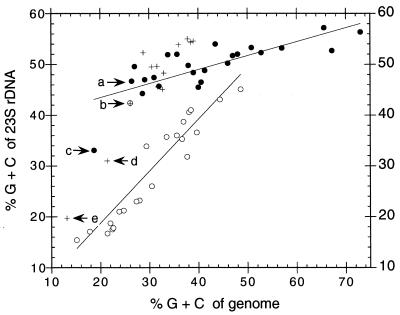
FIG. 7.
Comparison of the G+C content of 23S and 23S-like rDNA with the G+C content of the genome. ●, bacteria; ○, mitochondria; +, plastids; arrow a, B. aphidicola; arrow b, Reclinomonas americana; arrow c, Cr-Pve; arrow d, Toxoplasma gondii; arrow e, Plasmodium falciparum. Data compiled in January 2000 from GenBank and data in reference 15.

