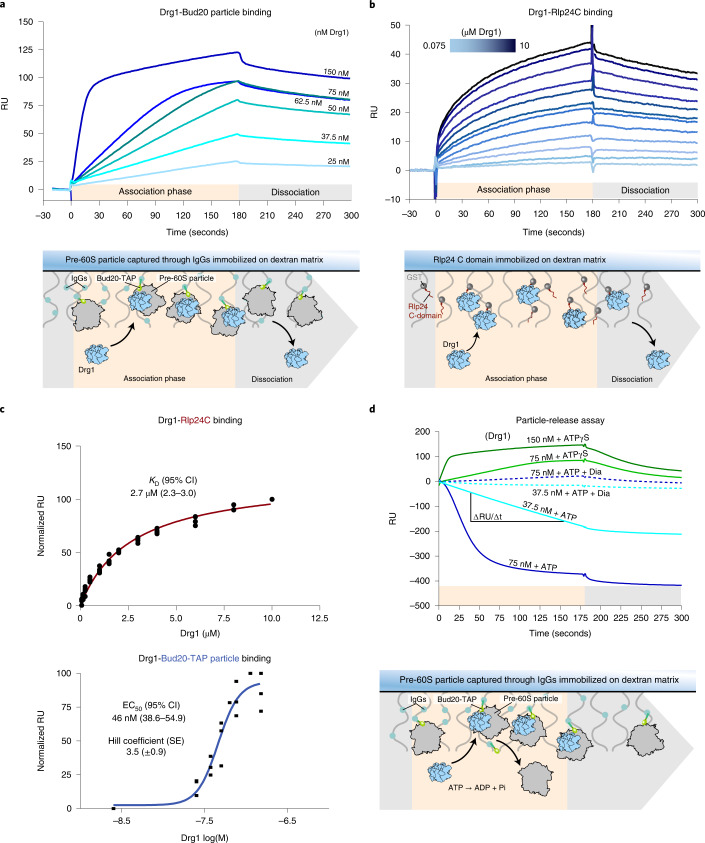
Fig. 6. Quantifying pre-ribosomal particle recognition and release by Drg1.
a, Binding of Drg1 to pre-60S particles captured on an SPR chip. pre-60S particles purified after LmB treatment were captured via the Protein A moiety of the Bud20-TAP tag on IgGs immobilized on the sensor chip. We injected 25–150 nM of purified Drg1 for 3 minutes in the presence of ATPγS. Sensorgrams of one representative binding series are shown. RU, response units. b, Binding of Drg1 to the Rlp24 C domain. GST-Rlp24C was immobilized as a ligand, and 0.075–10 µM of purified Drg1 was injected for 3 minutes in the presence of ATPγS. Sensorgrams of one representative binding series are shown. c, Normalized RU plotted over Drg1 concentration. Binding to Rlp24C was fitted using a one-site binding hyperbola. Binding to the Bud20-TAP particle was fitted using a sigmoidal dose–response curve (semi-log scale). Three biological replicates (n = 3) are shown. EC50 or KD are depicted with the 95% confidence interval (CI), hill slope with s.e. d, Measuring substrate processing using SPR (particle-release assay). Pre-60S particles purified after LmB treatment were captured on a sensor chip through their Bud20-TAP tag. Particle release triggered by Rlp24 extraction was quantified by measuring the RU over time in the presence of ATP, ATP + diazaborine (Dia) or ATPγS (binding control) with increasing Drg1 concentrations (37.5–150 nM). The release rate (ΔRU/Δt) was determined from the linear ranges of four 37.5 nM Drg1 injections (n = 4). Sensorgrams of one representative release series are shown.

