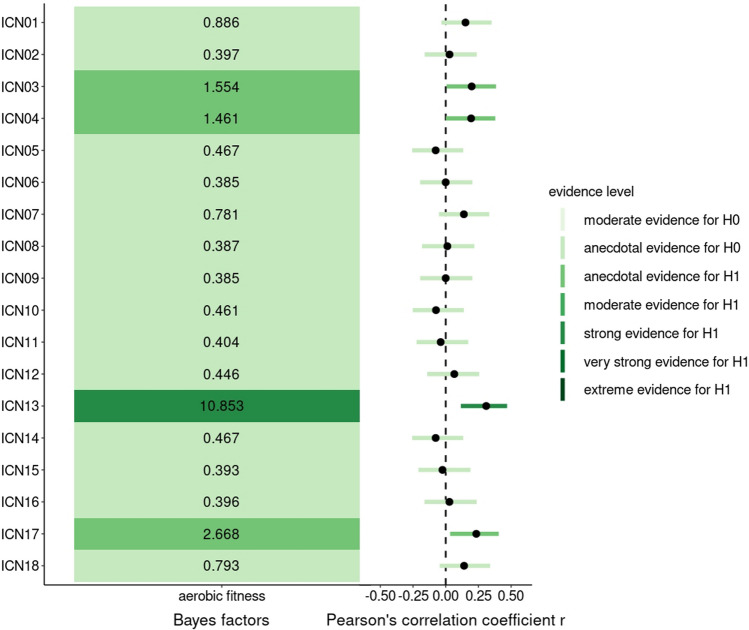
Fig. 5.
BFs and partial correlations between aerobic fitness and within-ICN connectivity. On the left-hand side, BFs of the multilevel partial correlation tests between aerobic fitness and within-ICN FC are displayed and colored according to evidence strength. On the right, the corresponding correlation coefficients and the HDIs are visualized. Categorical scheme of the BF10 according to Lee and Wagenmarkers [65]: BF10 > 1: anecdotal evidence for H1, BF10 > 3: moderate evidence for H1, BF10 > 10: strong evidence for H1, BF10 > 30: very strong evidence for H1, BF10 > 100: extreme evidence for H1, N = 58

