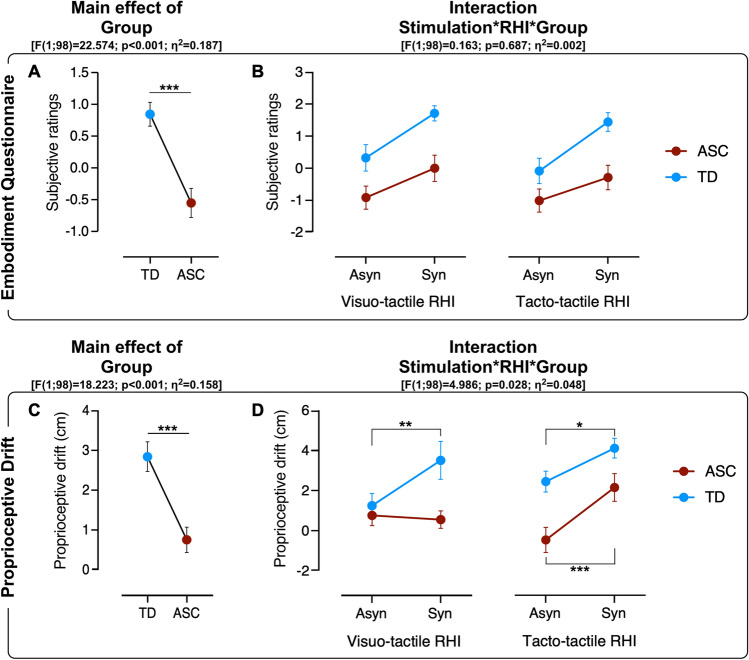
Fig. 2.
Experimental results. The top panel represents the mean subjective ratings after the visuo-tactile (top-left panel), and after the tacto-tactile (top-right panel) RHI. The bottom panel represents the mean proprioceptive drift after the visuo-tactile (bottom-left panel), and after the tacto-tactile (bottom-right panel) RHI. Panels A and C represent the Main effect of Group, whereas the panels B and D represent the Stimulation*RHI*Group interaction. Significant levels: *p < 0.05; **p < 0.005; ***p < 0.0005. Bars indicate standard errors of the mean (SEM)

