Fig. 1.

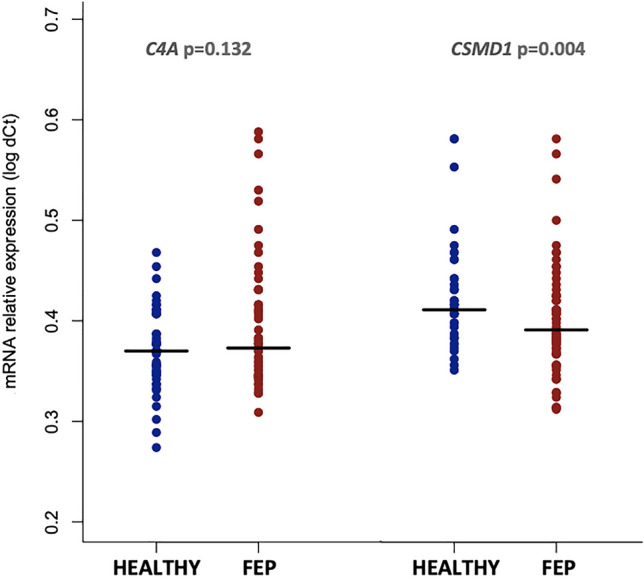
Relative mRNA expression levels for A C4A and B CSMD1 between healthy volunteers and FEP cases. Horizontal black lines indicate the median value for each group. P values were derived by a one-sided non-parametric Mann–Whitney test

Relative mRNA expression levels for A C4A and B CSMD1 between healthy volunteers and FEP cases. Horizontal black lines indicate the median value for each group. P values were derived by a one-sided non-parametric Mann–Whitney test