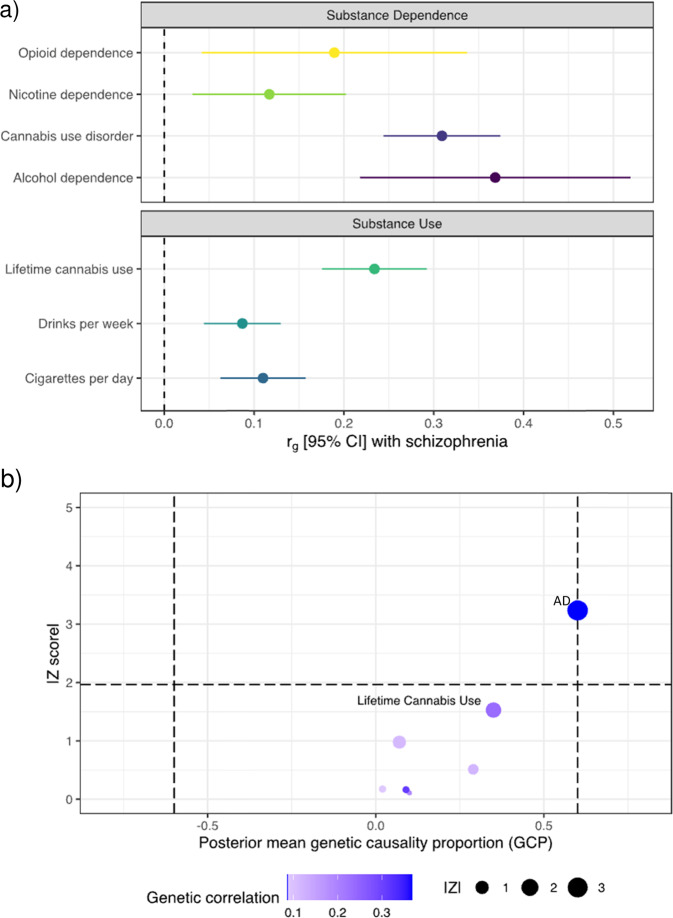
Fig. 1. Genetic relatioships between substance use disorders and schizophrenia.
a Genetic correlation forest plot between schizophrenia and SUDs (AD, CUD, ND, and OD), rg calculated using linkage disequilibrium (LD) score regression. b Latent causal variable (LCV) model to test for partial causality with posterior mean genetic causality proportion (GCP) estimates of each SUD on schizophrenia. Absolute magnitude of the Z-score relates to the test of whether the posterior mean GCP estimate is significantly different than zero. The vertical line represents genetic causality, with a posterior mean GCP > 0.6 implying partial genetic causality of trait 1 and trait 2, and inverse for GCP < −0.6. The horizontal line represents an absolute Z-score of ~1.96, which is nominal uncorrected significance (P < 0.05) for a test of whether GCP value is significantly non-zero.

