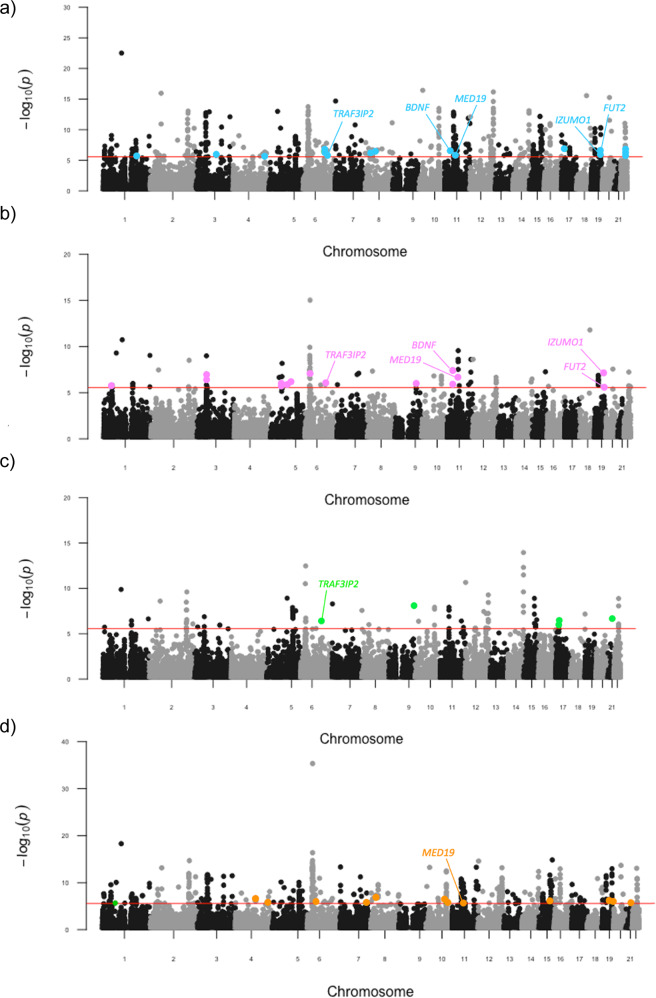
Fig. 2. Pairwise genic meta-analyses of schizophrenia and SUDs.
Manhattan plot for each meta-analysis that displays the −log10-transformed P-value for association for genes, which were tagged by at least one SNP in the respective GWAS. The red line represents the Bonferroni threshold for multiple-testing correction (P < 2.7 × 10⁻⁶). Genes highlighted on each plot were not Bonferroni significant in the individual GWAS, with overlapping genes across meta-analyses labelled. a SZ and AD, b SZ and CUD c SZ and ND, d SZ and OD.

