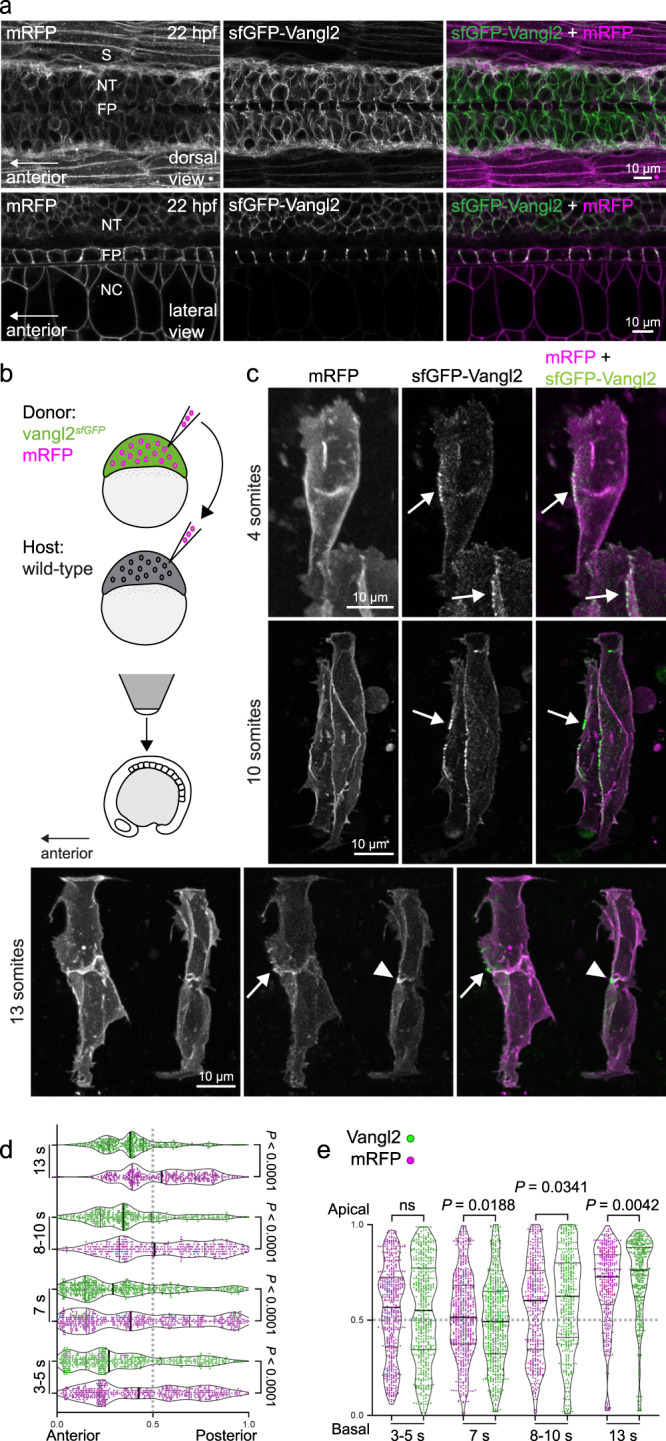
Fig. 2. Vangl2 is enriched in a planar polarized manner on anterior neuroepithelial membranes.

a Live confocal images comparing sfGFP-Vangl2 and membrane-RFP localization at 22 h post fertilization (hpf) in dorsal (top) and lateral (bottom) orientations. Anterior is to the left in all images. Strong Vangl2 expression is observed on cell membranes in the neural tube (NT) including the floor plate (FP), while only weak expression is observed in somites (S) and notochord (NC). A representative image from n = 3 embryos shown. b A schematic illustrating transplantation of membrane-RFP-labelled vangl2sfGPP donor cells into WT (wild-type) host embryos, at sphere stage. Chimeric embryos were imaged dorsally, at positions between the 2nd and 8th somite. c Representative confocal images of membrane-RFP and sfGFP-Vangl2 localization in the developing spinal cord of chimeric embryos at 4-somite, 10-somite and 13-somite stages of development, as quantified in (d, e). Maximum intensity projections are shown. Arrows point to Vangl2 enrichment on anterior neuroepithelial cell membranes, and arrowheads to anterior apical membranes at the neural midline. Anterior is to the left in all images. Distribution of the brightest sfGFP-Vangl2 and membrane-RFP spots along anterior-posterior (d) and apical-basal (e) axes of vangl2sfGFP neuroepithelial cells, quantified at four consecutive stages of neural tube morphogenesis. Data from multiple transplanted vangl2sfGFP cells was pooled (3-5 somites, n = 7; 7 somites, n = 7; 8-10 somites, n = 6; 13 somites, n = 5) and axial lengths normalized to 1. Details of the quantification can be found in the Methods section. Statistical analysis was performed using a two-tailed Mann-Whitney test. Thicker line shows median, and thinner lines first and third quartile. Source data are provided as a Source Data file.
