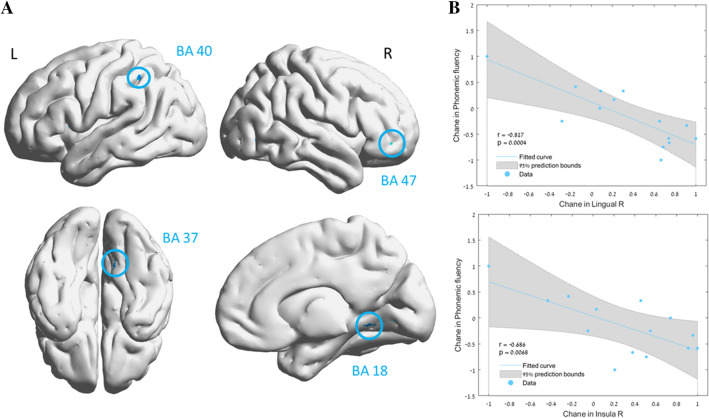
Figure 5.
Brain regions with significant post HBOT changes in mean diffusivity (MD). Group-by-time interaction ANOVA model in: (A) DTI—mean diffusivity (MD) in gray matter, p < 0.005, uncorrected (B). Significant correlation between change in phonemic fluency and the right lingual MD (BA 18), and right insula MD (BA 13). r is Pearson's correlation coefficient. The 95% prediction interval is presented in the shaded area. R right, L left, BA Brodmann area. Brain images were created using BrainNet Viewer Software (http://www.nitrc.org/projects/bnv/).

