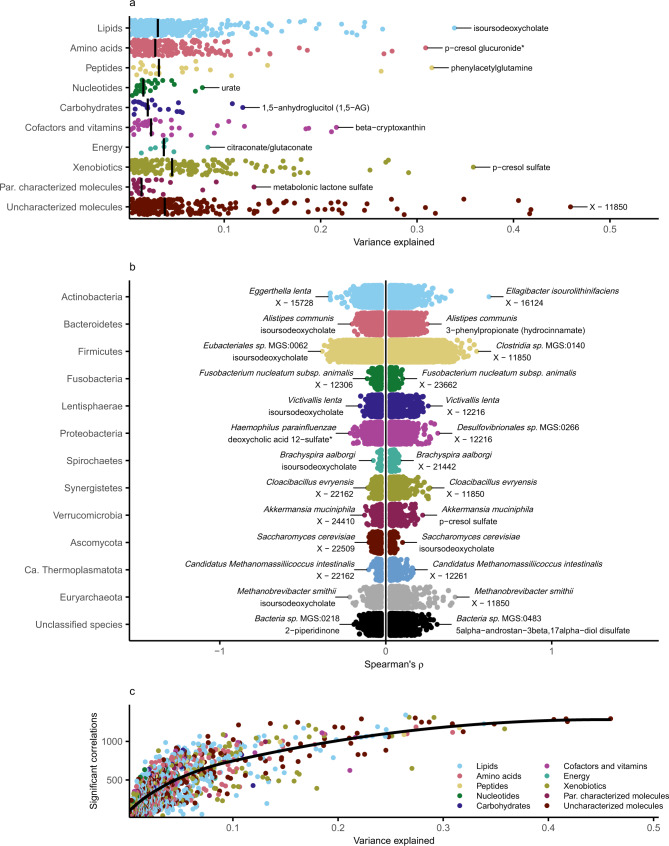
Fig. 2. Associations of gut microbiota with plasma metabolome show great variation across groups of species and metabolites.
a The variance in 1168 of the 1321 metabolites partly explained by variation in the gut microbiota from 8583 individuals aged 50 to 65 of the Swedish CArdioPulmonary bioImage Study. Models were fitted for each metabolite using ridge regression using nested 10-fold cross-validation. The variance explained was calculated as the cross-validated r2 statistic. Metabolites were grouped by metabolic pathway and the vertical line represents the median of the variance explained for each group. The metabolite with the largest variance explained for each group is annotated. b Partial Spearman’s rank correlations between 1528 gut microbial species and 1321 plasma metabolites adjusted for age, sex, place of birth, study site, microbial DNA extraction plate, and metabolomics delivery batch. Depicted are the Spearman’s ρ for 298,982 significant positive associations and 247,837 significant negative associations after adjusting for multiple testing using Benjamini–Hochberg’s method at 5% false discovery rate. Associations were grouped by taxonomic phylum. c Variance explained versus number of associated species for 1321 plasma metabolites. Metabolites were grouped by metabolic class. Shown in black is the locally estimated scatterplot smoothing line. Source data are provided as a Source Data file.

