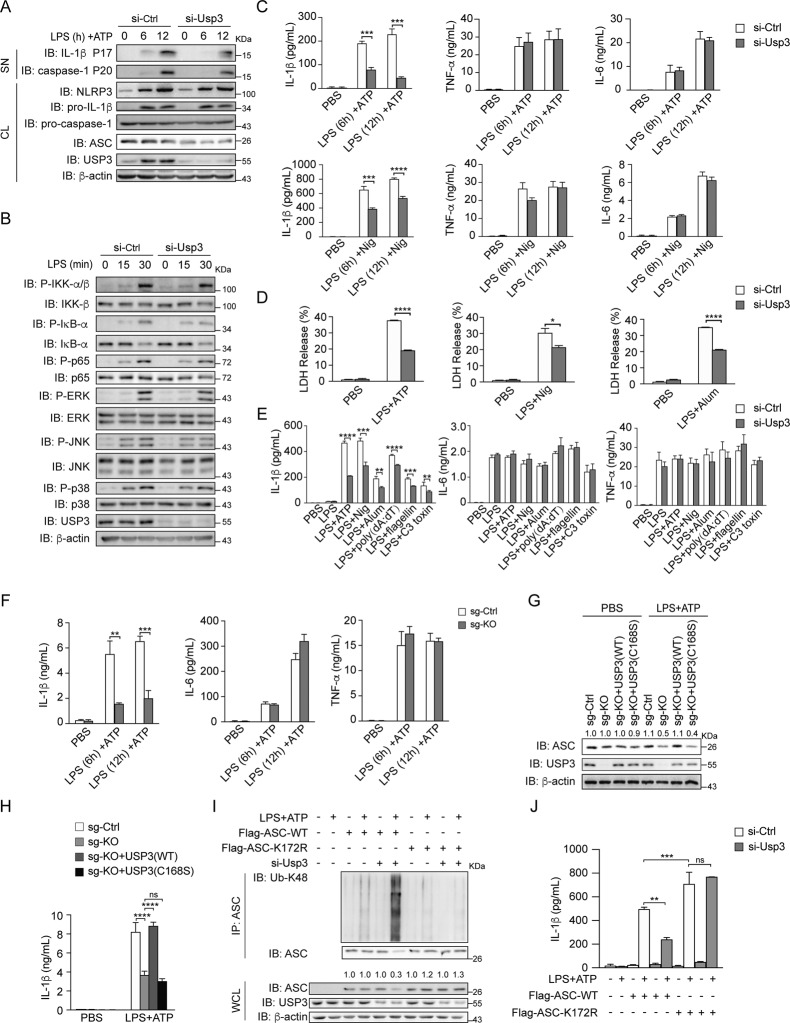
Fig. 5.
USP3 promotes NLRP3 inflammasome activation. A Immunoblot analysis of the supernatants (SN) or cell lysates (CL) of PMs with Usp3 silenced, primed with LPS for the indicated times, and stimulated with ATP for 30 min. B Immunoblot analysis of NF-κB and MAPK signaling in cell lysates of PMs with Usp3 silenced, followed by stimulation with LPS for the indicated times. C ELISA analysis of IL-1β, TNF-α and IL-6 secretion from PMs with Usp3 silenced, followed by treatment with LPS plus ATP (30 min) or Nig (45 min). D LDH release from PMs with Usp3 silencing, primed with LPS for 8 h, and stimulated with ATP (30 min), Nig (45 min) or Alum (6 h). Bars represent the mean percentage of LDH release relative to the total cells lysed. E ELISA analysis of IL-1β, TNF-α and IL-6 secretion from PMs with Usp3 silenced, primed with LPS for 8 h, and stimulated with ATP (30 min), Nig (45 min), Alum (6 h), poly (dA: dT) (1 h), flagellin (1 h) or C3 toxin (6 h). F ELISA analysis of IL-1β, TNF-α and IL-6 secretion from WT or USP3-KO THP-1 cells primed with LPS for the indicated times, followed by stimulation with ATP (30 min). G Immunoblot analysis of the protein levels of USP3 and ASC in WT, USP3-KO THP-1 cells and USP3-KO THP-1 cells reconstituted with USP3 or USP3-C168S. Cells were primed with LPS for 8 h, followed by stimulation with ATP for 30 min. H ELISA analysis of IL-1β secretion from WT, USP3-KO THP-1 cells and USP3-KO THP-1 cells reconstituted with USP3 or USP3-C168S. Cells were treated as in (G). I Immunoprecipitation analysis of the ubiquitination of ASC in RAW264.7 cells. RAW264.7 cells with Usp3 silenced were transfected with Flag-ASC or its lysine residue mutant K172R, treated with LPS for 8 h and stimulated with ATP for 30 min. Then, the cell lysates were immunoprecipitated with anti-ASC antibody and detected by immunoblotting. J ELISA analysis of IL-1β secretion from RAW264.7 cells. RAW264.7 cells were silenced for Usp3, transfected with Flag-ASC or its lysine residue mutant K172R, treated with LPS for 8 h and stimulated with ATP for 30 min. Data in (C–F, H, J) are from three independent experiments (n = 3) and are shown as the mean + S.D., and other data are representative of three independent experiments with similar results. *p < 0.05, **p < 0.01, ***p < 0.001; two-tailed Student’s t test. β-Actin was used as a loading control. The band density of ASC in (G, I) was quantified using ImageJ software and normalized to corresponding β-actin. The protein quantification is displayed above the corresponding band in the western blot figure

