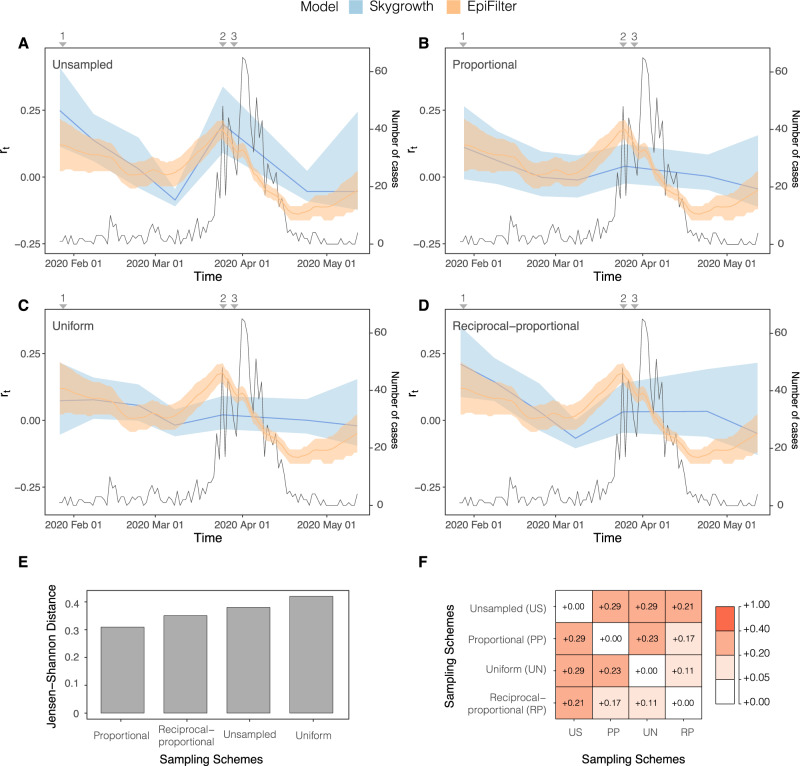
Fig. 5. rt estimated from both the Skygrowth and EpiFilter methods for Hong Kong.
Titles indicate the sampling scheme used in panels A–D. The light-shaded area represents the 95% highest posterior density interval. The solid line represents the mean rt estimate with EpiFilter in orange and Skygrowth in blue. The black line refers to the number of cases. We refer to Fig. 1 for a brief description of key events 1–3. The Jensen Shannon Distance (JSD) is given in E and ranks the sampling strategies based on how similar the Skygrowth estimates under those strategies are to those derived from EpiFilter (smaller values are better). F provides the pairwise JSD between the Skygrowth estimates under different sampling strategies, showing often appreciable difference among strategies.

