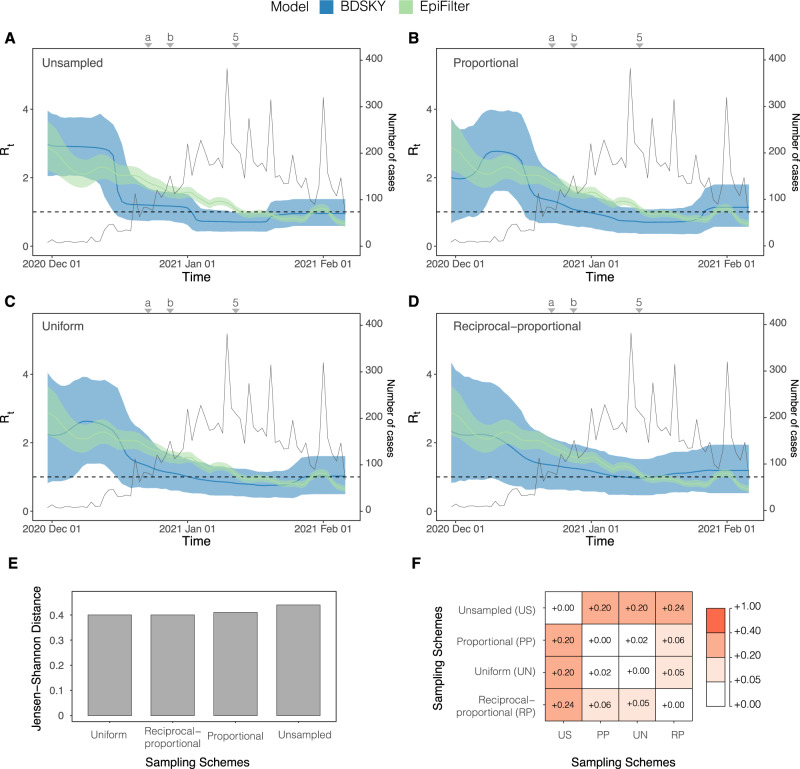
Fig. 6. Rt estimated from both the Birth Death Skyline (BDSKY) and EpiFilter methods for Amazonas, Brazil.
Titles indicate the sampling scheme used in panels A–D. The light-shaded area represents the 95% highest posterior density interval. The solid line represents the mean Rt estimate with EpiFilter in green and BDSKY in blue. We refer to Fig. 2 for a brief description of key events, including 5 which corresponds to the second lockdown. Event “a” corresponds to the suspension of commercial activities in Manaus; event “b” corresponds to the resumption of commercial activities in Manaus52. The Jensen Shannon Distance (JSD) is given in panel E and ranks the sampling strategies based on how similar the BDSKY estimates under those strategies are to those derived from EpiFilter (smaller values are better). Panel F provides the pairwise JSD between the BDSKY estimates under different sampling strategies, showing often appreciable difference among strategies.

