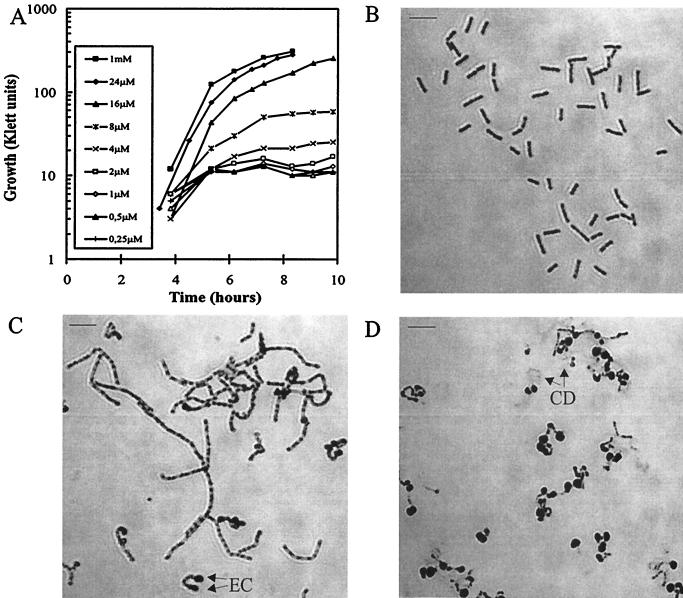
FIG. 7.
Morphological changes in cells depleted of PrsA. (A) Growth of IH7211 (Pspac-prsA) in the presence of different concentrations of IPTG. Photomicrographs show filament formation and cell shape of IH7211 grown in the presence of 32 μM IPTG (B), 16 μM IPTG (C), or 8 μM IPTG (D). Cells were Gram stained for microscopic examination. EC and CD denote enlarged cell and cell debris, respectively. The scale bars represent 8 μm.

