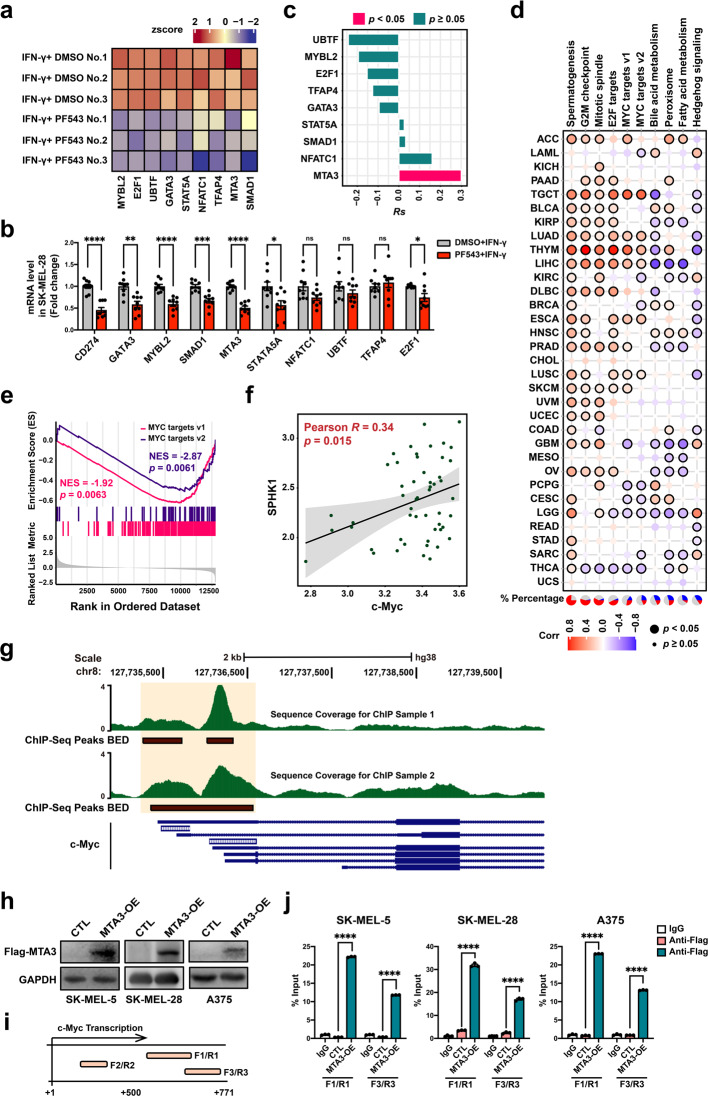
Fig. 3.
SPHK1 transcriptionally regulates MTA3 and c-Myc in melanoma cells. a Heat map of RNA-seq expression z-scores computed the candidate genes in SK-MEL-28 melanoma cells treated with PF543 (25 μM) and IFN-γ (200 ng/mL) for 24 h. See also Supplementary Table 5. b RT-PCR of CD274 and candidate transcription factors mRNA level was performed from the same sample as RNA-seq (n = 9). Data represent mean ± SEM. ns non-significant, p > 0.05, *p < 0.05, **p < 0.01, ***p < 0.001, and ****p < 0.0001. P values were calculated using unpaired two-sided Student’s t-test. c SPHK1 was positively correlated with MTA3 by using the calculation of Pearson’s correlation coefficient and subsequent significance test in 52 melanoma cell lines from the GDSC database. d Spearman’s correlation between MTA3 expression and MSigDB hallmark pathways across 33 cancer types. Pie charts in the left panel represent the percentage of cancer types with positive (red, Rs > 0.2, p < 0.05), negative (blue, Rs < −0.2, p < 0.05), and non-significant correlation (gray). e Enrichment plot of MYC target gene sets based on RNA sequencing. f Scatterplot for linear-regression of the association between c-Myc and SPHK1, as determined by Pearson’s correlation coefficient and significance test. The solid line corresponds to the regression estimate, and the corresponding 95% CIs, indicated by grey shading. g Overlaid images of MTA3 ChIP-seq enrichment from K562 cell line for two replicates. ChIP-seq tracks are obtained from published data. h SK-MEL-28 melanoma cells were transfected with MTA3 or negative control (CTL) vector. MTA3 expression was analyzed by western blot. i, j Locations of ChIP-qPCR primers at the c-Myc promoter, transcription start site is designated as nucleotide +1. F/R, Forward/Reverse (i). Input % of c-Myc DNA by IgG or Flag antibody were determined by ChIP-qPCR in melanoma cell lines (n = 3). j Data represent mean ± SEM. ns non-significant, p > 0.05, *p < 0.05, **p < 0.01, ***p < 0.001, and ****p < 0.0001. P values were calculated using unpaired two-sided Student’s t-test

