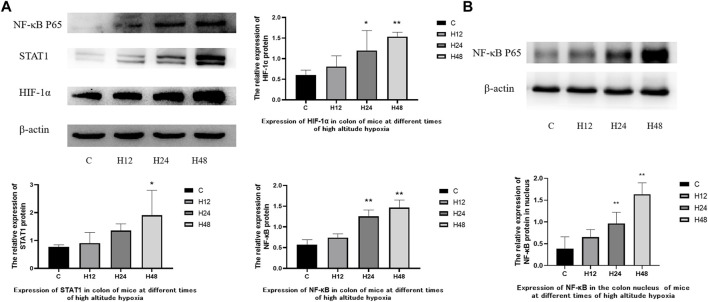
FIGURE 5.
Expression of colon-associated proteins in mice at different times of high-altitude hypoxia. (A) Expression of related proteins in total protein. (B) Expression of NF-κB P65 in nuclear proteins. 1: C, control group; 2, H12 group, the high-altitude group for 12 h; 3, H24 group, the high-altitude group for 24 h; H48, high altitude group for 48 h, n = 6. The data are presented as the mean ± standard error of the mean. *p < 0.05 vs. N group, **p < 0.01 vs. C group.

