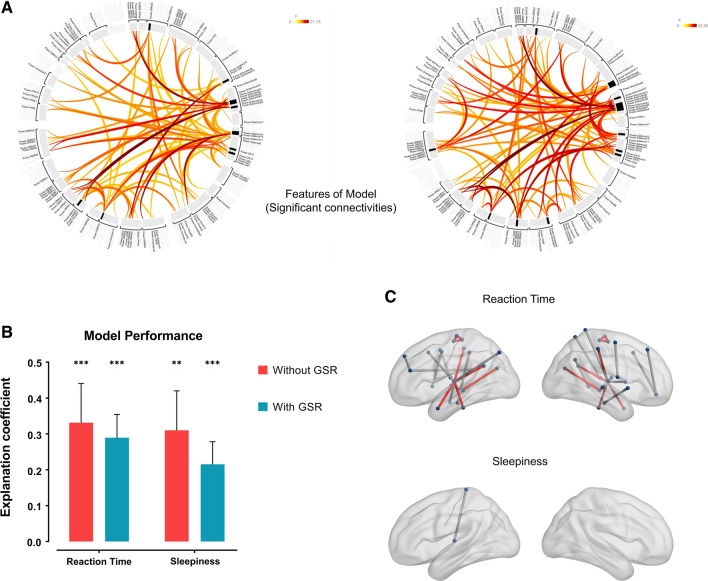
Fig. 4.
Results of the prediction model. A The features of the SVM model, which were significant connectivities after FDR p < 0.05 through the F-test. The left graph represents results without GSR (55 connectivities), while the right graph represents results with GSR (62 connectivities). B Explanation coefficient of the model. The primary model had achieved a decent performance in predicting reaction time of PVT (R2 = 0.3313, p = 0.0004) and sleepiness score of ARSQ (R2 = 0.3101, p = 0.0001). In the pipeline with GSR, model performance was slightly worse for reaction time (R2 = 0.2895, p = 0.0014) and sleepiness (R2 = 0.2153, p = 0.0004). The vertical line represents the standard deviation. ** and *** represents p < 0.01 and 0.001 separately. All the statistical results in this part are generated by the permutation test. C Significant connectivities to predict reaction time and sleepiness. Red lines represent overlapped results both in the pipeline without GSR and the pipeline with GSR. The left brain represents results without GSR, while the right-brain represents results with GSR. There is no significant connectivity to predict sleepiness score in the pipeline with GSR

