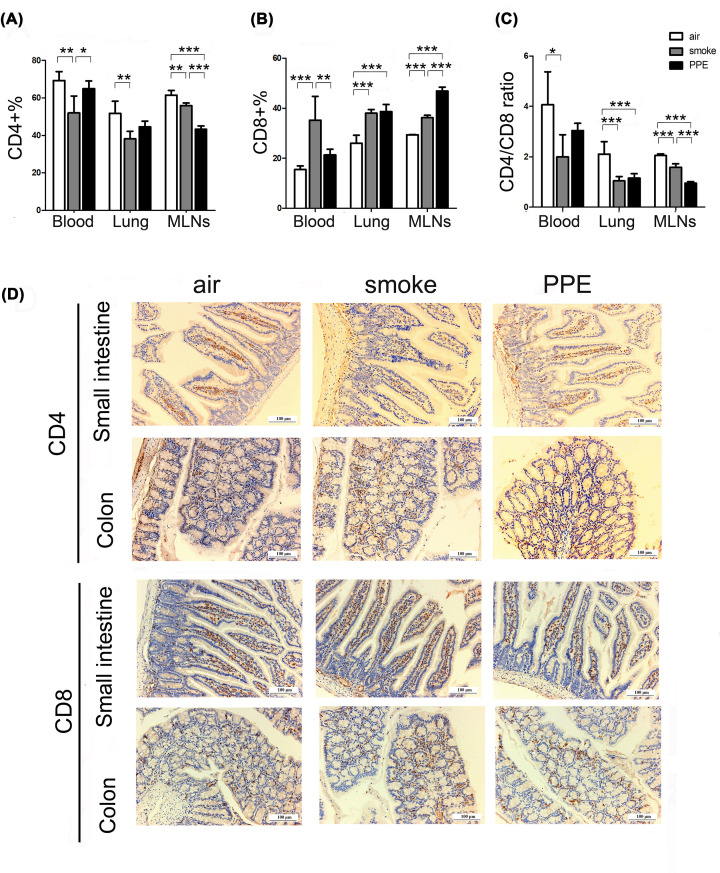
Figure 2. Changes in CD4+ T cells and CD8+ T cells occurred in the emphysema model.
(A–C) The percentage of CD3+CD4+ and CD3+CD8+ T cells, as well as the CD4+/CD8+ ratio in the blood, lung, and MLNs of air-exposed control (white histograms), CS exposure (gray histograms), and PPE administration (black histograms) mice were analyzed by flow cytometry as described (n=5 mice per group). Data are represented as means ± SD by one-way ANOVA. *P<0.05, **P<0.01, ***P<0.001. (D) Representative Immunohistochemical staining images of CD4+ and CD8+ T cells in the small intestine and colon from air-exposed control or emphysema model mice. Scale bar = 100 μm.

