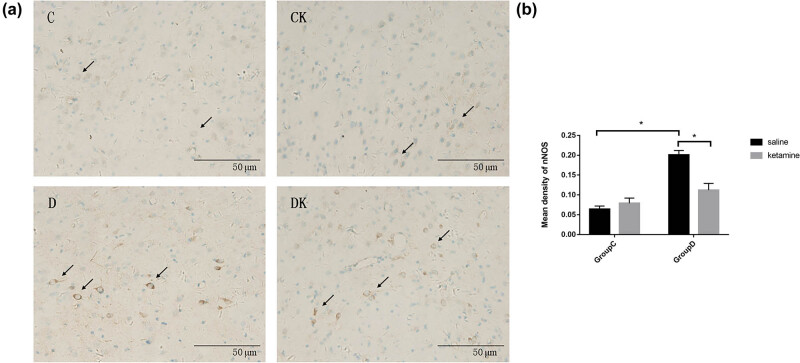
Figure 3.
(a) Immunostaining using anti-nNOS antibody in the PFC. The prefrontal cortexes were obtained 24 h after the last behavioral test. Arrows indicate positive expression of nNOS. Scale bar = 50 μm. (b) Quantitative analyses of nNOS in the PFC. The mean density of nNOS in the PFC was increased by the CUMS procedure and decreased by ketamine treatment. Data of these scores are presented as mean ± SD; * P < 0.05; NS, no significance; n = 12. Tukey’s multiple comparison test was used to compare differences between the groups.

