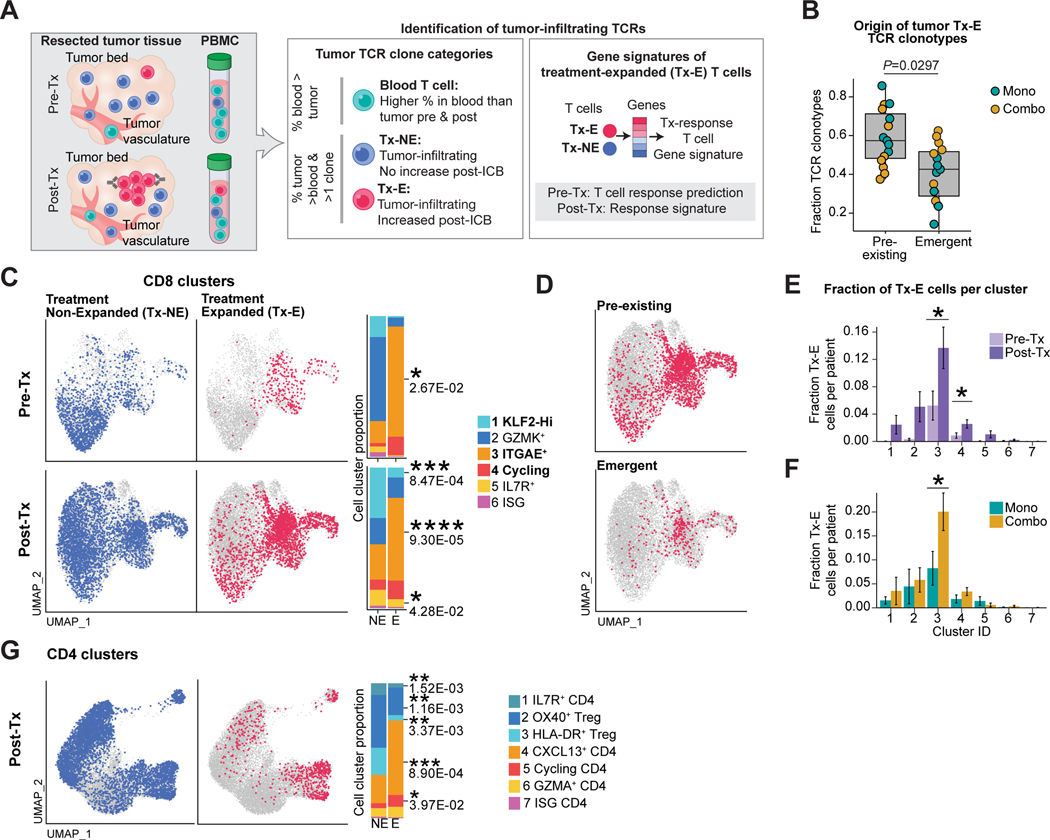
Figure 3: Treatment-induced clonal expansion of tissue-resident memory T cells.
A) Strategy for discovery of Tx-E and Tx-NE tumor TCRs.
B) Classification of Tx-E TCR origin. Fraction of each clonotype category is shown for individual patients (pre-existing vs emergent, paired two-sided t-test).
C) Projection of TCRs with significant Tx-E or Tx-NE onto UMAP embeddings of tumor CD8 TIL. Bar plots show fraction of Tx-E and Tx-NE cells in CD8 T cell clusters (paired two-sided t-test).
D) Projection of Tx-E TCRs onto post-treatment scRNA-seq data, grouped by pre-existing or emergent clonotypes.
E) Quantification of Tx-E cell fraction per cluster in pre-Tx versus post-Tx samples (average and SEM for each patient group, n=5 pre-Tx patients, n=13 post-Tx patients, two-sided t-test, *p < 0.05).
F) Quantification of Tx-E cell fraction per cluster in post-Tx samples comparing treatment cohorts (average and SEM for each patient group, n=7 mono patients, n=6 combo therapy patients, two-sided t-test, *p < 0.05).
G) UMAP embedding of post-Tx CD4 clusters highlighting tumor Tx-NE/Tx-E TCRs; bar plots show fraction of Tx-NE and Tx-E cells in tumor CD4 T cell clusters (paired two-sided t-test). See also Figure S3.

