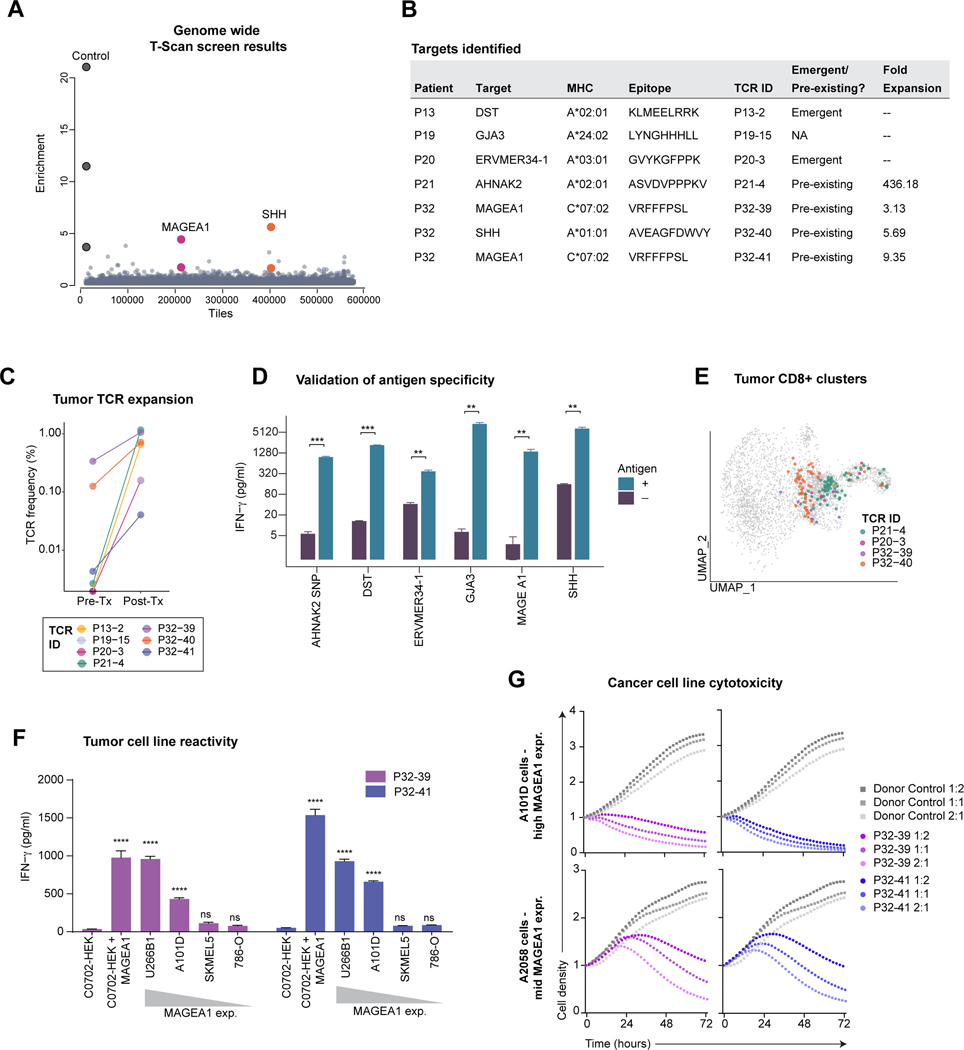
Figure 5. Identification of tumor-associated targets of expanded TCRs.
A) Representation of results from a genome-wide T-scan screen. Each circle represents a single 90-aa protein fragment; y-axis represents the fold-change of each peptide in relation to the unsorted input library (eight sorted replicates). Protein fragments with fold enrichment >2.5 that share overlapping peptide sequences from same target are highlighted.
B) HLA, TCR expansion and epitope information.
C) Treatment-related expansion of clonotypes with validated target antigens. Frequency calculated from bulk TCR β chain dataset.
D) Validation of the T-scan screen hits. Target cells (HEK293T) that expressed the relevant HLAs (indicated in B) were pulsed with the indicated peptides; non-pulsed cells were used as controls. IFNγ release by CD8+ T cells expressing the patient TCRs following incubation with target cells (average and SD of n = 3, ** P < 0.01; *** P < 0.001 Student’s t-test).
E) Projection of TCRs with validated target antigens onto tumor CD8 UMAP embedding. Three low-frequency TCRs were not identified in filtered CD8 T cell sub-clusters, although single-cell TCR pairs could be identified in un-filtered data.
F) Cancer cell reactivity of primary T cells expressing MAGEA1-specific TCRs. CD8+ T cells expressing P32-39 or P32-41 TCRs were co-cultured for 18h with a panel of C*07:02 positive cancer cell lines that expressed MAGEA1 at variable levels; HEK293T cells engineered to express C*07:02 ± MAGEA1 protein fragment were included as controls. IFNγ concentration in the supernatant was measured by ELISA assay. Each condition compared to C*07:02 HEK293 control (average and SD of n = 3, ****P < 0.0001 one-way ANOVA and Bartlett’s post-test).
G) Cytotoxic activity of T cells expressing MAGEA1-specific TCRs. A101D and A2058 tumor cells were co-cultured with P32-39 TCR, P32-41, or with non-transduced control donor T cells at indicated E:T ratios. Red fluorescence was measured over time and normalized to timepoint 0. Circles represent an average of n = 2.

