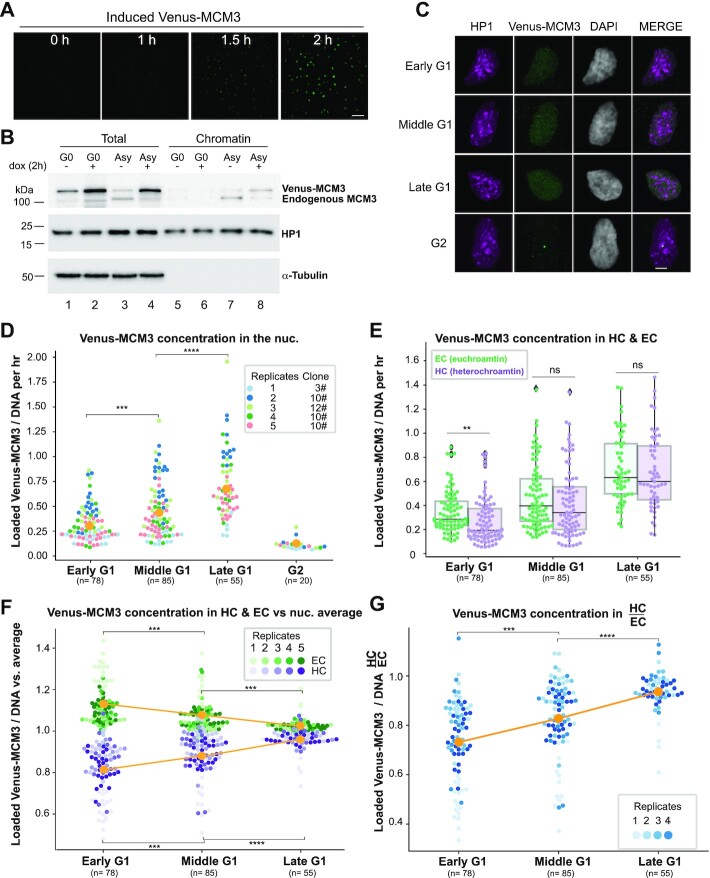
Figure 3.
The rate of MCM loading in early G1 is faster in euchromatin than in heterochromatin. (A) Selected images are shown from time-lapse imaging of RPE cells expressing PCNA-mTurquoise and DHB-mCherry reporters and dox-inducible mVenus-MCM3. mVenus-MCM3 expression was recorded every 10 min after the addition of 500 ng/ml dox; hours since induction are indicated; scale bar: 50 μm. (B) Cells were made quiescent (G0) by contact inhibition or left to proliferate asynchronously (‘Asy’) and then treated with 500 ng/ml dox for 2 h before harvesting. Whole cell lysates (‘total’) or chromatin fractions were analyzed by immunoblotting. (C) Projections of 3D immunofluorescence images of representative cells after live-cell imaging as in Figure 1: HP1 (magenta), Venus-MCM3 detected with anti-GFP antibody (green) and DNA stained with DAPI (gray); scale bar: 5 μm. Cells were treated with 500 ng/ml dox 2 h before the end of live-cell imaging. Quantification of loaded mVenus-MCM3 concentration (i.e. normalized to DNA) in whole nuclei (D) and in heterochromatin and euchromatin (E) after induction for 2 h. Boxplots in (E) show median and interquartile ranges, n (number of cells) is indicated in the figure and five biological replicates are shown. P-values are 0.008 (early G1), 0.219 (middle G1) and 0.595 (late G1). (F) Loaded Venus-MCM3 concentration in heterochromatin (lower purple dots) or euchromatin (higher green dots) relative to the average loaded Venus-MCM3 concentration in whole nuclei; mean is plotted in orange. (G) Ratio of Venus-MCM3 concentration in heterochromatin to euchromatin; mean is plotted in orange. For all comparisons, one-way ANOVA, Tukey post-hoc test and n (number of cells) is indicated on the figure panels. P-value ranges are indicated as *P ≤ 0.05, **P ≤ 0.01, ***P ≤ 0.001 and ****P ≤ 0.0001.

