Figure 3.
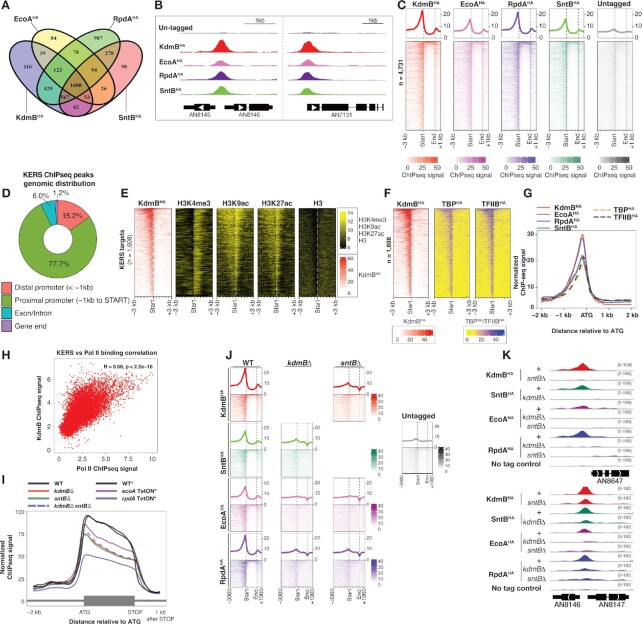
KdmB, EcoA, RpdA and SntB co-localized at thousands of promoters (A) A VENN diagram showing the number of common and unique genes between KdmBHA, EcoAHA, RpdAHA and SntBHA. (B) Genome-browser screenshots showing the binding location of KdmBHA, EcoAHA, RpdAHA and SntBHA. (C) Heatmaps displaying binding locations, signals and intensities of KdmBHA, EcoAHA, RpdAHA and SntBHA over their overall target genes (n = 4165). (D) A pie chart showing the distribution of the common KERS binding sites at distal promoters, proximal promoters, genic regions (exon/intron) and gene ends. (E, F) Heatmaps displaying ChIPseq signals of (E) KdmBHA, histone H3 lysine 4 trimethylation (H3K4me3), histone H3 lysine 9 acetylation (H3K9ac), histone H3 lysine 27 acetylation, histone H3, (F) TBPHA and TFIIBHA at the –3 kb to + 3 kb region with respect to the start codon (ATG) of KERS target genes. (G) A line graph showing the median binding signals of KdmBHA, EcoAHA, RpdAHA, SntBHA, TBPHA and TFIIBHA at the –2 kb to + 2 kb region with respect to the start codon (ATG) of KERS target genes. (H) A scatter plot showing the correlation between KdmB bindings at promoters and Pol II occupancies at coding regions. (I) A line plot showing the median Pol II ChIPseq signals between 2 kb upstream (–2 kb) of the translational start codon (ATG) to 1 kb downstream (+1 kb) of the translational stop codon of expressed genes in the WT and mutant strains deleted (Δ) or depleted (TetON) for the indicated subunit. The asterisk (*) indicates strains grown under the same experimental conditions for protein expression shutdown by the TetON system. (J) Heatmap plots showing binding locations, signals and intensities of KdmBHA, EcoAHA, RpdAHA and SntBHA in WT, kdmBΔ or sntBΔ background. (K) Genome-browser screenshots showing binding of KdmBHA, EcoAHA, RpdAHA and SntBHA in WT (+), kdmBΔ or sntBΔ background.

