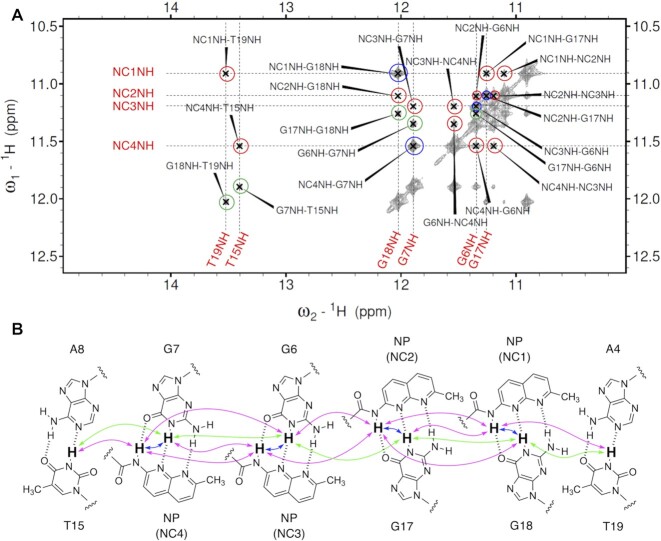
Figure 3.
(A) 1H–1H NOESY spectrum of the NCD-GG1 complex. Imino proton region (10–15 ppm) is shown expanded. Intermolecular NOEs between imino protons (G18, G17, G6 and G7) of guanine and amide protons of NPs (NC1 to NC4) within a base pair are indicated by blue circles. Sequential NOEs between imino and amide protons and between amide protons are indicated by red circles. Sequential NOEs between imino protons are indicated by green circles. (B) The schematic illustration shows the binding of two NCD molecules to the binding site. Blue, red, and green arrows correspond to the blue, red and green circles in Figure 3A.

