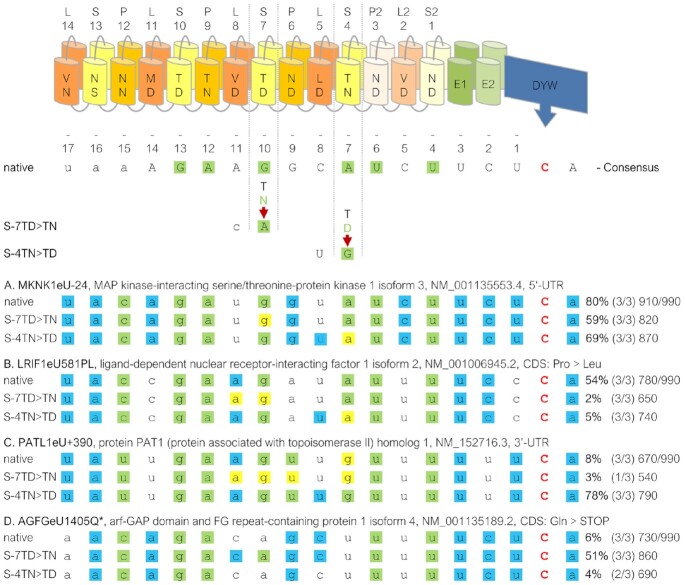
Figure 9.
Shifts of editing efficiencies in PPR56 mutants. Examples of four selected off-targets in mRNAs for MKNK1 isoform 3 (A), LRIF1 isoform 2 (B), PATL1 (C) and AGFG isoform 4 (D) that are shared between the native PPR56 and the two mutant data sets S-7TD > TN and S-4TN > TD, respectively. The PPR array indicating P-, L- and S-type PPRs and the crucial positions 5 and L for each PPR are indicated on top. A consensus derived from the off-target conservation profile (Figure 6) of native PPR56 is shown below with nucleotide preferences below the 40% threshold shown with small letters. Differences between the two mutants are shown below and matches according to the PPR-RNA binding code are highlighted in green. For the selected off-targets, green shading indicates fit to the PPR-RNA code, blue shading indicates additional fits to the respective PPR56 consensus and yellow shadings indicate disfavored fit by the three different PPR56 proteins. Numbers indicate average percentage of RNA editing observed (bold) in a respective number of up to three replicates (Supplementary Table S4). Arbitrary total matching scores are indicated at the ends of the respective lines. Matching scores are calculated as the sum of individual percentages for each position in the consensus profile that is occupied with a nucleotide dominating at least 40% in steps of 10% (see Figure 6A), resulting e.g. in a score of 40 for an A in position −14 or a score of 70 for a G in position −13. The total maximum possible score of 990 is indicated behind the slash.

