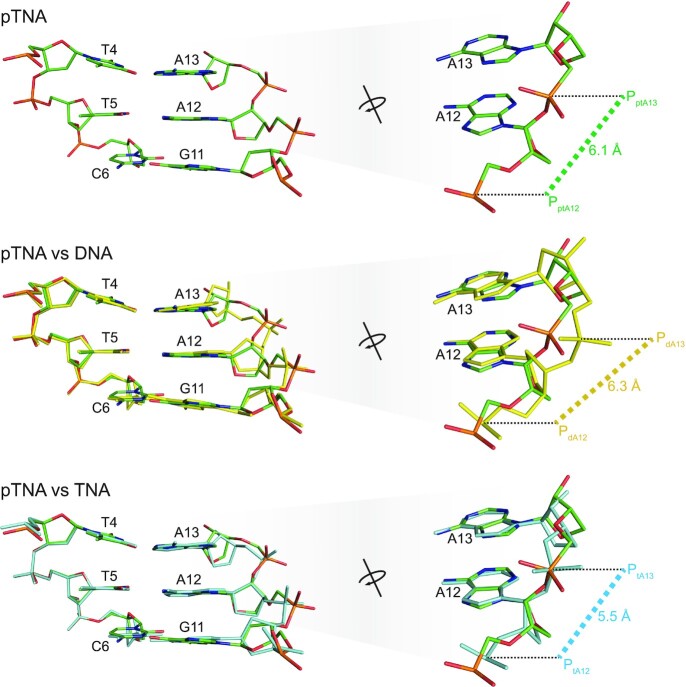
Figure 3.
Active site view of the DNA, TNA and pTNA adducts. Structural comparison of the backbone moiety of the DNA (yellow), TNA (cyan) and pTNA (green) residues following primer extension with Kod-RI. Images on the right provide an elevated and rotated view of the overlay shown on the left in the Watson–Crick base pairing format with the templating strand. The P–P distances are provided in units of angstroms.

