


Abstract
Ewing sarcoma is a prototypical fusion transcription factor-associated pediatric cancer that expresses EWS/FLI or a highly related FET/ETS chimera. EWS/FLI dysregulates transcription to induce and maintain sarcomagenesis, but the mechanisms utilized are not fully understood. We therefore sought to define the global effects of EWS/FLI on chromatin conformation and transcription in Ewing sarcoma cells using a well-validated ‘knock-down/rescue’ model of EWS/FLI function in combination with next generation sequencing assays to evaluate how the chromatin landscape changes with loss, and recovery, of EWS/FLI expression. We found that EWS/FLI (and EWS/ERG) genomic localization is largely conserved across multiple patient-derived Ewing sarcoma cell lines. This EWS/FLI binding signature is associated with establishment of topologically-associated domain (TAD) boundaries, compartment activation, enhancer-promoter looping that involve both intra- and inter-TAD interactions, and gene activation. In addition, EWS/FLI co-localizes with the loop-extrusion factor cohesin to promote chromatin loops and TAD boundaries. Importantly, local chromatin features provide the basis for transcriptional heterogeneity in regulation of direct EWS/FLI target genes across different Ewing sarcoma cell lines. These data demonstrate a key role of EWS/FLI in mediating genome-wide changes in chromatin configuration and support the notion that fusion transcription factors serve as master regulators of three-dimensional reprogramming of chromatin.
Graphical Abstract
Graphical Abstract.
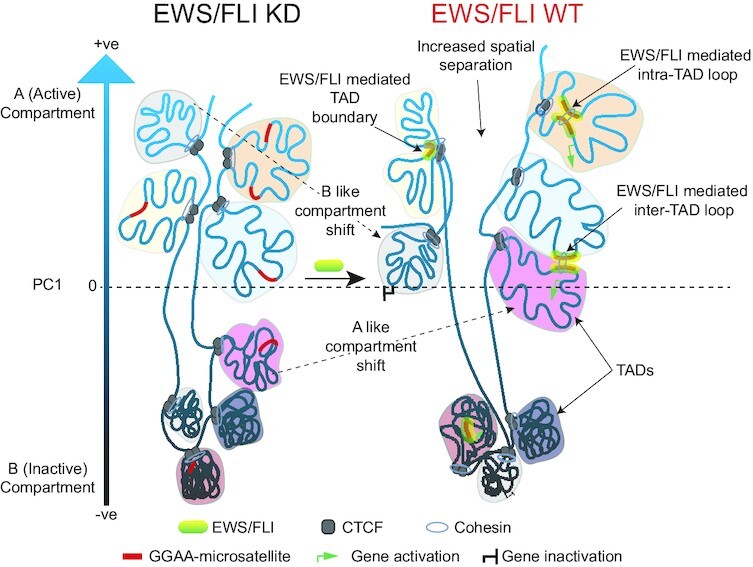
Schematic depicting reorganization of chromatin and changes to gene expression by EWS/FLI in Ewing sarcoma.
INTRODUCTION
Ewing sarcoma is a highly aggressive pediatric bone cancer characterized by a FET/ETS fusion oncoprotein expression (1–3). The FET family of RNA binding proteins, FUS, EWS and TAF15 contain largely conserved low complexity domains (LCD) at the amino terminus, while the ETS (E26 transformation specific) family of transcription factors contain a highly conserved winged helix-loop-helix DNA-binding domain (DBD) (4,5). EWS/FLI, the most common FET/ETS fusion found in Ewing sarcoma (in ∼85% of cases), is generated by the (11;22)(q24;q12) chromosomal translocation that fuses the amino terminus of the conserved FET LCD of EWS to the carboxyl terminus of FLI containing the ETS DBD (2,6,7).
The FLI ETS DBD of EWS/FLI is crucial for DNA binding and oncogenesis in Ewing sarcoma (8,9). Genome-wide localization studies have identified GGAA repeat elements (GGAA-microsatellites/GGAA-μsats) as well as consensus ETS sites (ACCGGAAGTG) as EWS/FLI response elements in Ewing sarcoma (10,11). GGAA-μsat binding by EWS/FLI is critical for its oncogenic function (11–13).
The conserved FET LCD of EWS in EWS/FLI can undergo liquid-liquid phase transition and multimerization in vitro (14). This multimerization property of the EWS LCD is required for EWS/FLI binding, chromatin accessibility, enhancer establishment, and formation of transcriptional hubs at GGAA-μsats in vivo (12,13,15–17). The ability to bind, multimerize and form transcriptional hubs at GGAA-μsats, suggests a model in which GGAA-μsats bound by EWS/FLI interact with other EWS/FLI bound DNA to promote chromatin looping, altered three-dimensional (3D) chromatin conformation, and dysregulated gene expression in Ewing sarcoma.
We evaluated this model using an unbiased whole-genome approach, in situ Hi-C (high-throughput chromatin conformation capture), to define the global changes in chromatin structure mediated by EWS/FLI in Ewing sarcoma (18). In this study, integration of Hi-C with CUT&Tag (cleavage under target and tagmentation), ChIP-sequencing, RNA-sequencing and 4C (circular chromatin conformation capture) demonstrates how EWS/FLI binding to chromatin alters the 3D chromatin landscape to facilitate an oncogenic transcriptional state in Ewing sarcoma.
MATERIALS AND METHODS
Reagents
Antibodies
Mouse monoclonal M2-anti-FLAG (Western blot; Sigma-Aldrich, F3165 and F1804), Rabbit monoclonal anti-H3 total (clone D1H2; Western blot; Cell Signaling Technology, 4499), Rabbit monoclonal recombinant anti-Lamin B1 (Western blot; Abcam, ab133741), Rabbit polyclonal anti-FLI1 (western blot and CUT&Tag Abcam, ab15289), Rabbit monoclonal recombinant anti-ERG [EPR3864] (CUT&Tag Abcam, ab92513), Rabbit polyclonal anti-CTCF (CUT&Tag Millipore Sigma, 07-729), Guinea pig anti-rabbit IgG (CUT&Tag Antibodies-Online, ABIN101961), Rabbit anti-mouse IgG (CUT&Tag Abcam, ab46540), IRDye® 800CW goat anti-mouse IgG (Western blot; LI-COR Biosciences, 926-32210), IRDye® 800CW goat anti-rabbit IgG (Western blot; LI-COR Biosciences, 926-32211), IRDye® 680LT goat anti-rabbit IgG (Western blot; LI-COR Biosciences, 926-68021).
Enzymes and recombinant proteins
Protein A-Tn5 transposase (S. Henikoff Laboratory, Fred Hutchinson Cancer Center, Seattle, WA, USA), T4 DNA ligase (NEB, M0202), MboI (NEB, R0147), NlaIII (NEB, R0125), Expand Long Template polymerase (Roche, 11759060001), RNAse A (ThermoFisher Scientific, AM2271), Proteinase K (ThermoFisher Scientific, 25530049).
Commercial kits
RNeasy Extraction Kit (Qiagen, 74136), iTaqTM Universal SYBR® Green One-Step Kit (BioRad, 1725151), BCA protein assay kit (Thermo Fisher, 23225), TruSeq Stranded mRNA Kit (Illumina, 20020594), Arima Hi-C kit (Arima Genomics, A410030), KAPA Hyper Prep Kit with Library Amplification Module (Roche, KK8500, KK8502), QIAquick PCR Purification Kit (Qiagen, 28104), NEBNext HiFi 2× PCR master mix (NEB, M0541), KAPA Unique Dual-Indexed Adapters Kit (15 μM; Roche, KK8727).
Biological resources
Cell lines
HEK-293 EBNA (human female; Invitrogen), A673 (human, female; ATCC, CRL-1598), SK-N-MC (human, female; ATCC, HTB-10), TC71 (human, male) and TTC-466 (human, female; T. Triche Laboratory, Keck School of Medicine of USC, Los Angeles, CA, USA), EWS-502 (human, sex unspecified; J.A. Fletcher Laboratory, Brigham & Women's Hospital, Boston, MA, USA).
Constructs and retroviruses
Oligonucleotide sequences for shRNAs targeting either Luciferase (Luciferase-RNAi, iLuc) or the 3'-UTR of endogenous EWSR1-FLI1 mRNA (EF-2-RNAi, iEF) were previously cloned downstream of the H1 promoter of the puromycin resistant pSRP RNAi retroviral vector as described (8). A 3X-FLAG tagged EWS/FLI cDNA (type IV breakpoint), was previously cloned into the pMSCV-Hygro retroviral vector as described (8,19).
Cell culture
HEK-293EBNA cells were cultured in DMEM supplemented with 10% heat inactivated fetal bovine serum (ΔFBS), 1% penicillin/streptomycin/glutamine (PSQ), and 0.3mg/ml geneticin. SK-N-MC cells were cultured in DMEM with L-Glutamine, supplemented with 10% fetal bovine serum (FBS) and 1% PSQ. A673 cells were cultured in DMEM with l-glutamine, supplemented with 10% FBS, 1% PSQ and 1% sodium pyruvate. TC71 and TTC-466 cells were cultured in RPMI 1640 media without l-glutamine, supplemented with 10% FBS and 1% PSQ. EWS-502 cells were cultured in RPMI 1640 media without l-glutamine, supplemented with 15% FBS and 1% PSQ. All cell lines were cultured at 37ºC and 5% CO2 and were authenticated by short tandem repeat (STR) profiling through Genetica (LabCorp).
EWS/FLI knock-down/rescue and selection
EWS/FLI knock-down in A673 cells was performed as described previously (8) via retroviral infection with shRNA targeting the 3' UTR of EWSR1-FLI1 transcript (iEF); shRNA targeting Luciferase was used as control for knock-down (iLuc). Rescue of EWS/FLI knock-down was carried out using either a 3X-FLAG tagged EWS/FLI cDNA construct devoid of 3' UTR (3X-FLAG-EF) or an empty pMSCV-hygro vector (e.v.) 4 h after infection with iEF to generate the EF-Rescue and EF-KD cells respectively. The control iLuc infection was rescued with e.v. to generate the EF-Endo cells expressing endogenous levels of EWS/FLI. Cells were kept in A673 culture media and double selection in A673 media supplemented with 2 μg/ml puromycin and 150 μg/ml hygromycin B was started 2–3 days post infection with the rescue constructs. Cells were selected for 7–11 days and harvested using trypsin. Trypsinized cells were spun down at 500 × g for 5 min, washed with 1× PBS, and pelleted at 500 × g for 5 min. Cell pellets were flash frozen in liquid nitrogen and stored at –80°C. EWS/FLI knock-down in TC71 cells was performed via retroviral infection using the iEF construct (EF-KD); the iLuc construct was used as a shRNA control (EF-Endo). Cells were grown in TC71 culture media for 2 days before selection was started in 2 μg/ml puromycin. Cells were selected for 2 days and harvested as above.
RNA isolation and RT-qPCR
Total RNA was extracted from frozen cell pellets using the RNeasy Extraction Kit as per kit protocol. Reverse transcription and qPCR was performed using the iTaq™ Universal SYBR® Green One-Step Kit on a Bio-Rad CFX Connect Real-Time System. Fold change (FC) was determined relative to the control sample (EF-Endo) after normalization to the reference gene RPL30 (RPL30 primers, Forward: 5'-GGGGTACAAGCAGACTCTGAAG; Reverse: 5'-ATGGACACCAGTTTTAGCCAAC). EWSR1-FLI1 primers (Forward: 5′-CAGTCACTGCACCTCCATCC, Reverse: 5′-TTCATGTTATTGCCCCAAGC) are specific to endogenous EWSR1-FLI1 transcript and do not target transcripts generated from expression of the EWS/FLI rescue cDNA construct. Statistical comparison between relative endogenous EWS/FLI1 expression in EF-Endo, EF-KD, and EF-Rescue in A673 cells was performed using Dunnett's T3 multiple comparisons test (Supplementary Table S1). Statistical comparison between relative endogenous EWS/FLI1 expression in EF-Endo and EF-KD in TC71 cells was performed using Unpaired t test with Welch's correction (Supplementary Table S2). Normality assumptions were assessed using QQ [quantile-quantile] plots. Unequal variance was assumed for variance ratios >2. Additional information on RT-qPCR data along with a completed checklist of MIQE (Minimum Information for Publication of Quantitative Real-Time PCR experiments) guidelines (20) are provided in Supplementary Tables S3 and S4.
Nuclear protein isolation
Nuclear proteins were isolated from fresh cell pellets re-suspended in 500 μl hypotonic buffer (20 mM HEPES [pH 8.0], 10% glycerol, 10 mM NaCl, 1.5 mM MgCl2, 1 mM EDTA, and 1 mM DTT) with protease inhibitor cocktail (Sigma, P8340) for 15 min. 12.5 μl of IGEPAL® CA-630 was added (to a final volume of 0.5%) and cells vortexed vigorously for 10 s to lyse the cytoplasm. Nuclei were pelleted at 1000 rcf for 5 min at 4°C and washed in 20 mM HEPES [pH 8.0], 10% glycerol, 140 mM NaCl, 1.5 mM MgCl2, 1 mM EDTA, 1 mM DTT and 1% IGEPAL® CA-630 with protease inhibitor cocktail. Nuclei were pelleted at 1000 rcf for 5 min at 4°C, snap frozen, and stored at –80°C. Proteins were extracted by incubation with RIPA buffer and protease inhibitor cocktail on ice for 1 h with occasional vortexing. Lysates were clarified by centrifugation at 16 000 rpm for 1 h at 4°C. Protein concentration was measured using a BCA assay.
Western blot and densitometry
Protein samples were prepared in 1× SDS loading buffer (Tris pH 6.8, 10mM; SDS 2%, bromophenol blue 0.6 mg/ml, 7.8% glycerol, 1.5% DTT) and boiled for 5 min prior to gel loading. Western blots were run on 7.5% Mini-PROTEAN® TGX™ Precast Protein Gels (Bio-Rad, 4561024) for 10 min at 90 V and 45 min at 120 V. Proteins were blotted onto nitrocellulose using the iBlot™2 (Thermo Fisher), probed for anti-FLI, anti-FLAG and anti-H3 or anti-Lamin B1 antibodies as loading control, and developed using LiCor Odyssey CLx Infrared Imaging System. Protein bands were converted to 8bit images and intensities were calculated using ImageJ v1.51j8. EWS/FLI band intensities (detected using anti-FLI antibody) were normalized to the respective loading control band and reported as EWS/FLI intensity relative to control for A673 cells. Comparisons between EWS/FLI band intensities were performed using Tukey's multiple comparisons test (Supplementary Table S5). Normality assumption was tested using QQ plot and equal sample sizes were used to minimize variance heterogeneity. EWS/FLI intensities normalized to the loading control band in TC71 cells are reported relative to the EWS/FLI intensity in the EF-Endo sample.
CUT&Tag experiments
CUT&Tag experiments were performed as described (21) with slight modifications. All CUT&Tag experiments were performed in duplicate. EWS/FLI CUT&Tag experiments were performed in A673, TC71, EWS-502, and SK-N-MC cells. EWS/ERG CUT&Tag experiments were performed in TTC-466 cells. CTCF CUT&Tag experiments were performed in A673 EF-Endo, EF-KD, and EF-Rescue cells and in TC71 EF-Endo and EF-KD cells. H3K27Ac CUT&Tag data was available in our laboratory and was previously published (22). BioMag® Plus Concanavalin A-coated magnetic beads (ConA beads, Bangs Laboratories, BP531; 10 μl beads per sample) were washed twice with Binding buffer (20 mM HEPES–KOH pH 7.9, 10 mM KCl, 1 mM CaCl2, 1 mM MnCl2). 250 000 cells per sample were washed twice with Wash buffer (20 mM HEPES–NaOH pH 7.5, 150 mM NaCl, 0.5 mM Spermidine, 1× cOmplete protease inhibitor [Roche, 04693159001]) and rotated with 10 μl ConA beads for 10 min at room temperature (RT). Beads bound to cells were separated using magnet stand and re-suspended in 100 μl Antibody buffer (20 mM HEPES–NaOH pH 7.5, 150 mM NaCl, 0.5 mM Spermidine, 0.05% digitonin, 2 mM EDTA, 1× cOmplete protease inhibitor). Antibodies (anti-FLI, anti-ERG, anti-CTCF, Rabbit anti-mouse IgG) were added at a dilution of 1:100. Samples were rotated overnight at 4°C. The samples were cleared on a magnet stand and beads were washed with Dig-wash buffer (20 mM HEPES–NaOH pH 7.5, 150 mM NaCl, 0.5 mM Spermidine, 0.05% Digitonin). Beads were re-suspended in 100 μl Dig-wash buffer and incubated with guinea pig anti-rabbit IgG at a dilution of 1:100 on a rotator for 1 h at 4°C. After three washes with Dig-wash buffer, beads were re-suspended in 100 μl Dig-300 buffer (20 mM HEPES–NaOH pH 7.5, 300 mM NaCl, 0.5 mM Spermidine, 0.01% Digitonin) with a 1:250 dilution of Protein A-Tn5 transposase fusion protein containing Escherichia coli spike-in DNA. Samples were rotated for 1 h at RT. After three washes with Dig-300 buffer, beads were re-suspended in 300 μl tagmentation buffer (Dig-300 buffer with 10 mM MgCl2) and incubated for 1 h at 37°C. Tagmentation was stopped by adding 10 μl 0.5 M EDTA, 3 μl 10% SDS, and 2.5 μl 20 mg/ml Proteinase K to each sample, vortexing 5 s, and incubating for 1 h at 50°C. DNA was purified using phenol–chloroform extraction and ethanol precipitation. DNA pellet was dried and re-suspended in 30 μl 10 mM Tris–Cl, pH 8 with 1 mM EDTA and 1/400 RNase A and incubated at 37°C for 10 min. Libraries were amplified using dual-indexed primers (Supplementary Table S6). 21 μl of DNA, and 2 μl of each primer (10 μM) were added to 25 μl of NEBNext HiFi 2× PCR master mix. Libraries were amplified using the following cycling conditions: 72°C for 5 min, 98°C for 30 s, 15 cycles of 98°C for 10 s and 63°C for 10 s, 72°C for 1 min. Amplified libraries were purified by adding 55 μl Agencourt AMPure XP magnetic beads to the PCR reactions, incubating 15 min, washing twice with 400 μl 80% ethanol, drying the DNA pellet, and eluting purified libraries in 25 μl Tris–Cl, pH 8. Illumina HiSeq4000 system was used to sequence the CUT&Tag libraries using 2 × 150 bp paired-end run.
CUT&Tag data processing and analysis
Quality control on raw sequencing reads were performed using FastQC [v0.11.4]. Adapter sequences and/or low quality reads were trimmed using Trim Galore [v0.4.4_dev]. Reads were aligned to the Genome Reference Consortium Human Build 37, GRCh37 (hg19) and spike-in E. coli (Escherichia_coli_K_12_DH10B NCBI 2008–03-17) reference genomes using Bowtie2 [v2.3.4.3] (23,24) with the following options ‘–no-unal –no-mixed –no-discordant –dovetail –phred33 -q -I 10 -X 700’. The ‘–very-sensitive’ option was added when aligning to spike-in genome. SamTools [v1.9] (25) was used to convert sam to bam with ‘-bq 10’ option to filter out reads with mapping quality score <10. A summary of the quality metrics for sequencing mapping of all CUT&Tag data are reported in Supplementary Table S7. CUT&Tag reads were spike-in normalized using DESeq2’s [v1.26.0] median ratio method (26) in R [v4.0.0] to eliminate bias across different samples, minimize the effect of outliers, and appropriately account for global occupancy changes. Scaling factor calculation for spike-in normalization of mapping quality filtered CUT&Tag data are reported in Supplementary Tables S8 and S9. Spike-in normalized bigwig tracks were generated and averaged across biological replicates using deepTools [v3.4.3] (27). Bigwig tracks for each experiment was further compared to the respective IgG control bigwigs using bigwigCompare from deepTools to generate tracks of log2 ratio between experimental and IgG CUT&Tag signal. Peaks were called with spike-in normalization using corresponding IgG as controls, and accounting for variation between the biological replicates using MACS [v 2.2.7.1] (28), DiffBind [v2.14.0] (29) and DESeq2. Batch corrected PCA plots were generated for each spike-in normalized CUT&Tag replicate to evaluate reproducibility of replicates for each sample. CUT&Tag integrates adapters into antibody-bound DNA sites and the exact sites are affected by accessibility. For this reason, fragments that mapped to the same exact positions are expected to be common and may not be due to duplication during PCR and are likely to be true fragments. Furthermore, GGAA-μsats are known to be regulatory elements in Ewing sarcoma, and reads mapping to repetitive GGAA-μsat sequences may also appear as duplicate reads. Therefore, all duplicate reads were retained in the analysis. Irreproducible Discovery Rate [IDR v2.0.3] (30) was used to identify reproducible and consistent peaks across replicates. To ensure high quality peaks that are most likely to represent biological signals, the final peak lists were generated using appropriate thresholds for IDR, log2FC, mean normalized counts of signal, and false discovery rate (FDR). EWS/FLI and EWS/ERG peaks were called using cut-offs: FDR <0.05, IDR <0.05, mean normalized counts ≥1, and log2FC ≥2 to identify all putative binding locations for EWS/FLI and EWS/ERG in each cell line. A highly conserved list of EWS/FLI and EWS/ERG peaks were identified by overlapping peaks from all five cell lines (A673, SK-N-MC, EWS-502, TC71 and TTC-466) using R packages ChIPpeakAnno [v3.24.2], and GenomicRanges [v1.42.0] (31,32). UpSetR [v1.4.0] was used to visualize the number of EWS/FLI and EWS/ERG peak regions overlapping across all 5 cell lines (33). Homer motif finding tool from Homer package [v4.11.1] was used to determine enriched motifs associated with the conserved EWS/FLI peaks in A673 (34).
H3K27Ac peaks were called after spike-in normalization using the following parameters: FDR <0.05, IDR <0.005, mean counts ≥50, and log2FC ≥3. Ranked order of super-enhancers (ROSE) was used to identify all enhancers (including both typical enhancers and super-enhancers) from H3K27Ac localization data (35,36). The default stitching distance of 12.5 kb was used and 2.5 kb distance from transcription start sites (TSS) was excluded to account for promoter biases. Differential H3K27Ac peaks and enhancers for EF-Endo versus EF-KD and EF-Rescue versus EF-KD were identified using the DiffBind and DESeq2 R packages. DeSeq2 was used to perform read count normalization and identification of peaks and enhancer regions that are differentially enriched for H3K27Ac signal (FDR < 0.05). EWS/FLI enrichment at differential enhancer regions were compared using Tukey's multiple comparisons test (Supplementary Table S10). Normality was assumed for large sample sizes, equal variance was assumed for variance ratios <2.
ChIP-sequencing data processing and analysis
ChIP-sequencing data for cohesin subunits SMC1A and Rad21 were downloaded from published sources (37,38). Two replicates of spike-in normalized SMC1A data were downloaded from Adane et al., and one replicate each of SMC1A and Rad21 were downloaded from Surdez et al.(37,38). Spike-in normalized bigwig files were available publicly for Adane et al. (38). Data downloaded from Surdez et al. 2021 were processed similarly to that in Surdez et al. (37): Bowtie2 [v2.4.1] was used to align sequencing data to the hg19 reference genome. Reads were sorted and filtered for duplicate, unmapped and multimapper reads using Sambamba [v0.7.1]. Bigwig files were generated for SMC1A, Rad21 and Input control using bamCoverage from deepTools. Heatmap and profile plots were generated using Input normalized SMC1A and Rad21 signals using plotHeatmap and plotProfile functions from deepTools.
RNA-sequencing experiments, data processing, and analysis
RNA-sequencing was performed on two biological replicates each of EF-Endo and EF-KD TC71 samples. Total RNA were extracted from frozen cell pellets using RNeasy Extraction Kit as per kit protocol and submitted to the Nationwide Children's Hospital Institute for Genomic Medicine for RNA quality measurements (RIN and DV200; Supplementary Table S11), library preparation, sequencing, and differential gene expression analysis for EF-Endo versus EF-KD in TC71 cells. TruSeq Stranded mRNA Kit was used to prepare cDNA libraries from total RNA and sequenced on Illumina HiSeq4000 using 2 × 150-bp paired-end run. Low-quality reads (q < 10) were filtered out and adaptor sequences trimmed from raw reads using bbduk [v37.64]. Each sample was aligned to the hg19 reference genome using STAR [v 2.6.0c] (39) and analyzed for differential gene expression between EF-Endo and EF-KD in TC71 cells using DESeq2. Quality metrics and sequencing summary for TC71 RNA-sequencing are reported in Supplementary Tables S12–S14. Differential gene expression data for EF-Endo versus EF-KD and EF-Rescue versus EF-KD in A673 cells were available in the laboratory and was previously published (40).
In situ Hi-C experiments
In situ Hi-C was performed in duplicate for EF-Endo, EF-KD and EF-Rescue A673 cells from 2 million frozen cells per replicate fixed in 1X PBS with 2% formaldehyde at RT for 10 min and quenched with 0.250 M glycine at RT for 5 min and on ice for 15 min. Crosslinked cells were stored in –80ºC and later processed using the Arima Hi-C kit as per the kit protocol to obtain proximally-ligated DNA libraries. 100 μl proximally-ligated DNA was fragmented using Covaris water bath sonicator (peak power = 70 W, duty factor = 20%, cycles per burst = 1000, duration = 35 s) to obtain peak fragment size of 395–418 bp. Fragments were size selected and biotin enriched per Arima Hi-C protocol. Dual indexed library preparation and amplification was performed using the KAPA Hyper Prep Kit with Library Amplification Module according to the Arima Hi-C Kit protocol to obtain libraries with 505–525 bp average fragment size. Index sequences are listed in Supplementary Table S15. In situ Hi-C libraries were sequenced on Illumina Hi-Seq 4000 using 2 × 150 bp paired-end runs.
Hi-C data processing
Hi-C paired-end reads were and processed using publicly available Arima Genomics Mapping pipeline (https://github.com/ArimaGenomics/mapping_pipeline): BWA-MEM (41,42) was used to align the Hi-C reads to the hg19 reference genome. Reads were first mapped independently as single-ends and then paired. Chimeric reads (mapping to the ligation junction) were filtered to retain the read that maps in the 5'-orientation. The filtered single-end Hi-C reads were paired, sorted, and mapping quality filtered (mapping quality > 10; Supplementary Table S16). PCR duplicates were removed using Picard Tools [v2.20.3] (Supplementary Table S17). The processed files were used to perform compartment, TAD and differential interaction analysis. Hi-C summary files (.hicsum) were generated from the processed data using the publicly available iHiC pipeline (43). Hi-C summary files for each sample was processed with the makeTagdirectory function from Homer package to independently calculate interaction frequencies over genomic distance where the fraction of total paired-end reads at different distances are recorded at 1kb resolution for each sample (44). These frequencies were not normalized between samples. Hi-C contact matrices (.hic files) were generated using the Juicer pipeline (45) and were visualized using Juicebox [v1.9.8] (46). Quality statistics for Hi-C sequencing data are summarized in Supplementary Table S18.
Compartment analysis
Homer [v4.11.1] Hi-C analysis pipeline was used to generate normalized interaction matrices from processed Hi-C data and to perform Principal Component Analysis (PCA) of the normalized interaction matrices using a resolution of 20 kb, window size 40 kb and genome hg19 (44). The algorithm identifies chromosomal compartments using the PC1 component. To distinguish between A (active) and B (inactive) compartments, homer uses the locations of TSS as ‘active’ chromatin regions to assign the sign of PC1 values. Regions with positive PC1 values were identified as ‘A compartment’ and regions with negative PC1 values were identified as ‘B compartment’. Chromosomal compartments were also visualized using the Juicebox visualization tool by generating Pearson correlation maps at 1 mb resolution from coverage normalized Hi-C data (46). To identify genomic regions that show compartment shifting we used the findHiCCompartments.pl tool in the Homer package to define regions showing ≥0.4 change in eigenvalue (PC1). A-like shifts were defined as regions changing PC1 value by ≥0.4, and B-like shifts were defined as regions changing PC1 value by ≤–0.4 in EF-Endo versus EF-KD and in EF-Rescue versus EF-KD.
Genes mapping to stable and shifting compartments were annotated using R and Games-Howell's multiple comparisons test was used to compare differential gene expression signatures for stable, A-like and B-like compartment shifts in EF-Endo versus EF-KD and EF-Rescue versus EF-KD (Supplementary Table S19). Normality was assumed for large sample sizes, and unequal variance was assumed for variance ratios >2. Differential H3K27Ac peaks were mapped to their respective stable, A-like and B-like compartments and Tukey's multiple comparisons test was used to compare H3K27Ac signature at stable and shifting compartments (Supplementary Table S20). Normality was assumed for large sample sizes, and equal variance was assumed for variance ratios <2.
Histogram analysis was performed using the annotatePeaks.pl tool in Homer package to plot the distribution of PC1 values around EWS/FLI binding sites. 20kb compartmental segments directly overlapping EWS/FLI peaks were identified using BEDTools’ [v2.29.2] intersect function and were further separated into the type of EWS/FLI binding site (GGAA-μsat or non-μsat) to determine the effect of EWS/FLI binding locations on compartment shifting genome wide. Tukey's multiple comparisons test was performed to compare PC1 values at EWS/FLI binding sites between EF-Endo, EF-KD and EF-Rescue (Supplementary Table S21). Normality was assumed for large sample sizes and equal variance was assumed for variance ratios <2.
Analysis of TAD and TAD boundaries
TADs and TAD boundaries were identified using iHiC pipeline and TopDom [v0.0.2] (43,47). The pipeline was used to identify TAD boundaries as 20kb genomic bins that allow minimal contact between bins upstream and downstream of the boundary region compared to their neighboring bins (P value < 0.05). Overlapping boundaries across multiple conditions were identified using the ChIPpeakAnno and GenomicRanges R packages. UpSetR was used to plot overlapping TAD boundaries. CTCF peaks were called from CUT&Tag data after spike-in normalization using the following parameters: FDR <0.05, IDR <0.01, mean counts ≥100, and log2FC ≥3. Heatmaps of CTCF occupancy at TAD boundaries were generated using deepTools’ functions computeMatrix and plotHeatmap. EWS/FLI enrichment at different TAD boundary regions were compared using Tukey's multiple comparisons test. Normality was assumed for large sample sizes, equal variances were assumed for variance ratios <2 (Supplementary Table S22). Heat maps and profile plots for EWS/FLI, CTCF, SMC1A and Rad21 were generated using deepTools to determine the binding pattern of these factors at the EWS/FLI sites identified near EF-WT boundaries
DiffHiC [v1.22.0] R package (48) was used to partition the genome into 20 kb bins. Using the domainDirections function in diffHiC, the total number of read pairs between each 20 kb bin and a 200 kb span upstream or downstream of that bin was calculated from processed Hi-C data to yield two counts per 20 kb bin (up and down). Low abundance bins were removed and the up and down counts were used to calculate a directionality statistic (DS) for each bin by computing the log fold change ratio between up and down counts for each bin in each condition (EF-Endo, EF-KD and EF-Rescue). The DS is similar to the directionality index defined by Dixon et al. (49), where the magnitude of the DS identifies the size of interaction preference for a target bin, while the positive/negative signs provide information about downstream/upstream directionality preference of interaction for that target bin. The rotPlaid function in diffHiC R package was used to generate locus specific Hi-C heatmaps.
Differential interactions analysis
Differential interactions were detected from processed Hi-C data for EF-Endo versus EF-KD and EF-Rescue versus EF-KD using diffHiC. The mapping location of each de-duplicated and map quality filtered read was matched to a restriction fragment in the hg19 reference genome and the resulting data were used to filter out reads with large (>700 bp) and unpaired fragments. The reference genome was divided into either 1 mb or 20 kb contiguous bins and interaction intensity between any two bins (bin pair) in the genome were calculated by counting the number of read pairs that have one of the paired-reads successfully mapped to each of the two bins. Bin pairs with low abundance read counts were directly filtered to retain bin pairs with abundances that are at least 10-fold higher than the median abundance of inter-chromosomal interactions to account for non-specific ligations. The resulting data were TMM normalized to reduce composition biases. Variability in read counts was modelled to reduce the significance of any differences in counts detected between biological replicates, and significance testing was performed to identify differential interactions at 20 kb and 1mb resolution (FDR < 0.05 and |fold change| > 4) in EF-Endo versus EF-KD and EF-Rescue versus EF-KD using the R package edgeR [v3.32.1] (50,51).
Multidimensional scaling (MDS) plots of distances between Hi-C replicates were generated using the plotMDS function from the limma [v3.46.0] R package for the top 1000 interactions at 1mb resolution (52). Volcano plots of differential interactions were generated using EnhancedVolcano [v1.8.0] R package. 1mb interactions were split into lost (FDR < 0.05 and fold change < –4) or gained interactions (FDR < 0.05 and fold change > 4). Calculation of the interaction distance for the differential interactions were performed by filtering out inter-chromosomal interactions and measuring the genomic distance between the midpoints of the two loop anchors spanning the retained intra-chromosomal interactions. Loop lengths were compared between gained and lost loops at 1mb resolution using Unpaired t test with Welch's correction (Supplementary Table S23). Normality was assumed for large sample sizes and unequal variances was assumed for variance ratio >2. The motif finding tool findMotifsGenome.pl from the Homer package was used to determine enriched motifs associated with gained loop anchors at 20kb resolution.
Gained (FDR < 0.05 and fold change > 4) and lost (FDR < 0.05 and fold change < –4) interactions at 20 kb resolution were annotated for genes in differential expression dataset for EF-Endo versus EF-KD and for EF-Rescue versus EF-KD in A673 cells using subsetByOverlaps function in GenomicRanges R package. Differential expression of these genes were visualized by plotting volcano plots using the EnhancedVolcano R package.
All stable and differential interactions detected at 20 kb resolution using diffHiC were categorized into EWS/FLI bound and unbound loops using BEDTools’ pairToBed function to identify loops that overlap a conserved EWS/FLI peak. Comparisons of loop enrichment at EWS/FLI bound versus unbound regions were performed using unpaired t test (Supplementary Table S24). Normality was assumed for large sample sizes and equal variances was assumed for variance ratios <2. EWS/FLI bound loops were sub-categorized by the type of EWS/FLI binding site underlying the loop anchors (–/–, MS/MS, MS/NMS, MS/–, NMS/NMS, NMS/–) to determine the role of EWS/FLI binding site (MS = GGAA-μsat, NMS = non-μsat) in differential loop enrichment. Comparisons of loop enrichment in EF-Endo versus EF-KD underlying different types of EWS/FLI binding sites were performed using Games–Howell's multiple comparisons testing where normality was assumed for large sample sizes and unequal variances assumed for variance ratios >2 (Supplementary Table S25). Comparisons of loop enrichment in EF-Rescue versus EF-KD underlying different types of EWS/FLI binding sites were performed using Tukey's multiple comparisons testing where normality was assumed for large sample sizes and equal variances assumed for variance ratios <2 (Supplementary Table S25). All interactions detected at 20 kb resolution were also mapped to differential enhancer regions (stable, gained and lost enhancers) to determine the association between enhancers and loop enrichment. Comparisons of 20 kb loop enrichment at differential enhancers were performed using Tukey's multiple comparisons test (Supplementary Table S26). Normality was assumed for large sample sizes and equal variances was assumed for variance ratios <2. All gained interactions at 20 kb resolution (FDR < 0.05 and fold change > 4) were sub-categorized as inter- or intra- TAD loops where loops with ≥90% overlap with a TAD region were identified as intra-TAD, and loops with <90% overlap with a TAD region were identified as inter-TAD. The proportion of gained inter-TAD loops for MS/MS and MS/NMS were compared to the expected proportion of inter-TAD loops in a control set of loops. A control set of 1000 loops were randomly picked from all 20kb interactions and the inter-TAD loop proportions were recorded one thousand times as the expected proportion of inter-TAD loops. The average proportion of expected inter-TAD loops was used as control in a one-sample proportion test to determine whether MS/MS and MS/NMS gained loops show a significantly greater inter-TAD loop proportion than the control. To determine the relationship between EWS/FLI, CTCF and cohesin localization near gained loop anchors, EWS/FLI, CTCF and SMC1A binding sites near all gained loops were identified and interrogated for EWS/FLI, CTCF, SMC1A and Rad21 localization using heatmaps and profile plots. Pearson correlation analysis was also performed between EWS/FLI, CTCF and SMC1A binding intensities at these sites to determine any significant correlation between these factors.
EWS/FLI bound differential interactions at 20 kb resolution (FDR < 0.05 and |fold change| > 4) were mapped to genomic GGAA sequences of varying repeat lengths using BEDTools’ pairToBed function. These differential interactions were further categorized by (i) the total number of genomic GGAA repeats underlying the interactions (maximum distance between each GGAA motif ≤ 20 bp), and by (ii) the number of consecutive GGAA repeats underlying the interactions (maximum distance between each GGAA motif = 0 bp). We found only two differential interactions mapping to 20 or more consecutive GGAA repeats which were not very informative and were excluded from this analysis. Differential interactions were ranked by logFC values (for EF-Endo versus EF-KD and EF-Rescue versus EF-KD) and Spearman's rank correlation analysis was performed to determine the relationship between GGAA repeat lengths and loop enrichment. One-tailed two-sample proportion tests were performed to determine significant differences in proportions of gained loops for different GGAA repeat lengths: total GGAA repeats and consecutive GGAA repeats. Alternatively, Fisher's exact test was performed for small expected sample sizes (<5). Test statistics for comparisons between two categories are reported in Supplementary Tables S27–S29.
Identification of direct EWS/FLI target genes
Direct target genes were identified as genes that (i) have TSS located within 20 kb of a conserved EWS/FLI binding site or overlapping a 20 kb loop anchor of a gained loop with at least one anchor overlapping a EWS/FLI site (ii) are significantly altered in expression between EF-Endo and EF-KD in A673 cells (adjusted P-value < 0.05 and |fold change |> 1.25). Differentially expressed genes located within 20 kb of a GGAA-μsat or non-μsat bound EWS/FLI site were identified using subsetByOverlaps function in R. Differentially expressed genes located under a EWS/FLI loop at 20 kb resolution were identified by merging differential gene expression data from RNA-seq to genes mapping to gained loops at 20 kb resolution using Ensembl ID and filtering out genes that are not bound by a EWS/FLI loop. The two datasets were combined and duplicates were removed to generate a list of direct EWS/FLI target genes. These direct EWS/FLI target genes were then categorized into genes that are either directly upregulated (adjusted P-value < 0.05 and fold change > 1.25; Supplementary Table S30) or directly downregulated (adjusted P-value < 0.05 and fold change < –1.25; Supplementary Table S31) by EWS/FLI. A subset of these direct targets mapping to EWS/FLI mediated chromatin loops are listed in Supplementary Table S32.
Gene set enrichment analysis (GSEA)
GSEA [v4.0.3] (53,54) was used to analyze functional association between genes directly regulated by EWS/FLI in A673 cells and genes differentially regulated in TC71 cells upon EWS/FLI knock-down. Direct EWS/FLI regulated genes in EF-Endo versus EF-KD A673 cells were used as gene sets for up- and down-regulated genes. Differentially expressed genes in EF-Endo versus EF-KD TC71 cells were rank ordered by log2FC for comparison with the A673 EWS/FLI direct target gene sets. Significance was determined using |NES| > 1.5, FDR q-value < 0.05 and FWER P-value < 0.05.
4C experiments
4C sequencing libraries were prepared in duplicate following published protocol (55). For each replicate, ∼5 million EF-Endo, EF-KD and EF-Rescue A673 cells and EF-Endo and EF-KD TC71 cells were trypsinized and re-suspend in 2.5mL isolation buffer (10% FBS/PBS). 2.5 ml of 4% fixation buffer (1 ml 37% formaldehyde + 8.25 ml isolation buffer) was added and cells were cross-linked for 10 min. Cold glycine was added to a final concentration of 0.125 M to quench the fixation reaction and cells were centrifuged at 1000 × g for 5 min at 4ºC. Cells were washed with ice cold PBS, pelleted, flash frozen and stored at –80ºC. Thawed pellets were gently re-suspended in 1 ml lysis buffer (50 mM Tris–HCl pH 7.5, 0.5% Igepal, 1% TX-100, 150 mM NaCl, 5 mM EDTA) with 1× cOmplete protease inhibitor, incubated on ice for 20 min, spun down, supernatant removed, and the nuclei washed in 450 μl 1.2 × RE1 buffer (NEB rCutSmart™). Nuclei were re-suspended in 500 μl 1.2× RE1 buffer, 10% SDS was added to a final volume of 0.3%, and incubated while shaking at 750 rpm for 1 h at 37°C. 20% Triton-X 100 was added to a final volume of 2.5% and incubated in a thermomixer at 750 rpm for 1 h at 37°C. 100U of MboI (primary restriction enzyme) was added and incubated in a thermomixer at 750 rpm for 3 h at 37°C. A second round of 100 U of MboI was added and incubated in a thermomixer at 750 rpm overnight at 37°C. MboI was heat inactivated at 65°C for 20 min. Proximity ligation was performed by incubating the samples for 24 h at 16°C using 50 U of T4 DNA ligase in 7 ml of 1× ligation buffer (660 mM Tris–HCl, pH 7.5, 50 mM MgCl2, 50 mM DTT and 10 mM ATP). 30 μl Proteinase K (10 mg/ml) was added and cross-links were reversed by incubating overnight at 65°C to create 3C template DNA. The 3C template was purified using Nucleomag PCR beads (‘P-beads’), eluted in 450 μl 5mM Tris–HCl (pH 8.0), and stored at –20°C. Second restriction digest was performed in 500 ul of 1× RE2 buffer (NEB rCutSmart™) at 37ºC overnight in a thermomixer at 500 rpm using 50 U of NlaIII. NlaIII was heat inactivated at 65°C for 20 min. DNA was quantified using Qubit and a second ligation reaction was carried out in 5 ml 1× ligation buffer with 25 μg of template and 50 U T4 DNA ligase at 16°C overnight. Samples were purified using P-beads as above and stored at –20°C. PCR amplification was performed in 50 μl PCR reactions using 200 ng of 4C template, 1 μl of dNTPS (1 mM), 5 μl of 5 uM reading primer, 5 μl of 5 uM non-reading primer, and 0.7 μl of Expand Long Template polymerase (Reading primer: 5'-TACACGACGC TCTTCCGATC TGACTCGTCC CAAACTCTTA GCCTC; Non-reading primer: 5'-ACTGGAGTTC AGACGTGTGC TCTTCCGATC TCTAGGGCAG ACAGATAACA G). PCR cycling program used: 94ºC for 2 min; 16 cycles: 94ºC for 10 s, 50ºC for 1 min, 68ºC for 3 min; 68ºC for 5 min. Libraries were purified using 0.8× AMPure XP purification and a second round of PCR was performed in 50 μl of 1× PCR buffer with 1 μl of 10mM dNTPs, 5 μl of the purified product, 5 μl of 5 μM universal primer mix (Supplementary Table S33), 0.7 μl of Roche Expand Long Template polymerase mix. PCR cycling program used for second PCR: 94ºC for 2 min; 20 cycles: 94ºC for 10 s, 60ºC for 1 min, 68ºC for 3 min; 68ºC for 5 min. PCR amplified 4C libraries were purified using Qiagen PCR purification kit and primer dimers removed using 0.8× Ampure XP bead purification. 4C libraries were run on the High Sensitivity D5000 tape for library quantitation and were sequenced with Illumina MiSeq (A673 samples) and MiniSeq (A673 and TC71 samples) sequencing systems using 2 × 75 bp paired-end runs. Only the read containing the reading primer was used for further analysis. Reading primer was used to target the GGAA-μsat at ∼60 kb upstream of NKX2-2 (right most microsatellite, RMS) as the region of interest (viewpoint).
4C data processing and analysis
4C sequencing data were processed using the pipe4C [v1.00] analysis pipeline (55). Global parameters were set using the global configuration file (conf.yml; Supplementary Table S34) and experiment specific parameters were set using the viewpoint file (vPFile; Supplementary Table S35). The pipe4C pipeline was then run using the command: Rscript pipe4C.R –vpFile = ./fastq/VPinfo.txt –fqFolder = ./fastq/ –outFolder = ./outF_A673_TC71_NKX2-2_4Cseq/ –cores 12 –plot –wig. The pipe4C pipeline demultiplexes the reads to retain only reads containing the reading primer. Trimming of reads was performed to extract the capture sequence between the two restriction sites. Reads were then mapped to the hg19 reference genome using Bowtie2. The pipeline counts reads per fragment end and creates an in silico fragment end library using the Bioconductor BSgenome.Hsapiens.UCSC.hg19 [v1.4.3] R package. The fragments ends were trimmed based on capture length and only reads that mapped uniquely to the reference genome with the capture length were counted. The read counts were normalized for sequencing depth to a total sum of 1 million mapped reads per sample. Quality metrics of 4C sequencing data are summarized in Supplementary Table S36. Regions that have higher contact frequency than expected were identified using peakC [v0.2] (55). peakC models the background contact frequency for regions upstream and downstream of the viewpoint and identifies genomic regions that are significantly contacted by computing non-parametric statistics based on ranks of coverage of 4C fragment ends with respect to the background model.
Statistics
All statistical testing are reported in Supplementary Tables S1, S2, S5, S10 and S19–S29. The normality and variance assumptions for these tests are referenced next to the corresponding analysis detailed above. Significance was determined as a P value <0.05. All Fisher's exact test, two-sample, and one-sample tests for proportionality were performed in R. All other comparisons between two or more groups were performed in GraphPad Prism (version 9).
RESULTS
EWS/FLI reprograms the global interaction profile in Ewing sarcoma
To understand how EWS/FLI affects 3D chromatin conformation in Ewing sarcoma, we depleted EWS/FLI from patient derived Ewing sarcoma cells and compared chromatin features between EWS/FLI expressing and depleted states. Endogenous EWS/FLI (EF-Endo) was knocked-down from A673 cells using RNAi (EF-KD), and subsequently rescued with ectopic expression of a 3X-FLAG tagged EWS/FLI cDNA construct (EF-Rescue), using a well-validated knock-down/rescue system with direct functional consequences to transcription and oncogenic transformation in Ewing sarcoma cells (8,56). The EF-Rescue experiment was used to confirm that the changes observed between EF-Endo and EF-KD were not off-target effects of RNAi. EWS/FLI knock-down and rescue of expression were verified using reverse transcription-quantitative polymerase chain reaction (RT-qPCR) and western blot analysis (Supplementary Figures S1A–E). In situ Hi-C experiments were performed in duplicate, in EF-Endo, EF-KD and EF-Rescue A673 cells to obtain 278–433 million total read pairs per replicate, of which 72–73% of the read pairs were retained after filtering out low mapping quality (MAPQ < 10) and duplicated reads to give 201–311 million unique paired-end reads per replicate (Supplementary Figure S2A). In this study, chromatin features in EWS/FLI containing (EF-WT) states, i.e. EF-Endo and EF-Rescue were compared to chromatin features in the EWS/FLI depleted state, i.e. EF-KD.
We first generated genome-wide contact maps using the Hi-C data for EF-Endo, EF-KD and EF-Rescue (Supplementary Figure S2B). Off diagonal inter-chromosomal signals represent chromosomal rearrangements in A673 cells, many of which were reported previously (e.g. t(1;9), t(1;13), t(3;16), t(5;8), t(9;13), t(11;13) and t(11;22); (57). To determine whether EWS/FLI promotes global changes in the chromatin interaction profile, we performed multidimensional scaling (MDS) analysis of the top 1000 interactions at 1 megabase (mb) resolution in EF-Endo, EF-KD and EF-Rescue (Figure 1A). EF-Endo clustered with EF-Rescue, and were separated from the EF-KD replicates, demonstrating that the changes in interaction profiles observed with EWS/FLI depletion are largely reversed by re-expression of the ‘rescue’ EWS/FLI.
Figure 1.

EWS/FLI reprograms the global interaction profile in Ewing sarcoma. (A) Multidimensional scaling (MDS) plot of top 1000 interactions (1 mb resolution) in each Hi-C replicate. (B) Genome-wide interaction frequency over interaction distance (bp) calculated for each 1 kb region in EF-Endo, EF-KD and EF-Rescue A673 cells. (C) Volcano plot showing differential interactions (DI) detected at 1mb resolution for EF-Endo versus EF-KD A673 cells using diffHiC R package. DI, FDR < 0.05 and |fold change (FC)| > 4. See also Supplementary Figure S2C. (D) Percent DIs gained (FDR < 0.05 & FC > 4) or lost (FDR < 0.05 & FC < –4) at 1mb resolution. (E) Violin plots of interaction distance (bp) for DIs (EF-Endo versus EF-KD). **** P value < 0.0001 (Unpaired t-test with Welch's correction). See also Supplementary Figure S2D and Table S23. (F) Example of lost and gained interactions (EF-Endo versus EF-KD) spanning a 59.7 mb region in chromosome 7. 1 mb loop anchors are depicted by horizontal bars at the ends of each loop. Stable interactions not shown. See also Supplementary Figure S2E.
We next asked whether higher order intra-chromosomal interactions were globally altered by EWS/FLI. We plotted interaction frequency over linear genomic distance for all intra-chromosomal interactions and found a decrease in long distance (2–20 mb) interactions and an increase in shorter distance (0.1–1 mb) interactions in EF-WT cells as compared to EF-KD cells (Figure 1B). To determine whether these differences were significant, we used the diffHiC package to perform differential interaction analysis at 1 mb resolution (FDR < 0.05 and |fold change| > 4) to assess the status of long-range interactions (48). We identified differential interactions in EF-Endo versus EF-KD and in EF-Rescue versus EF-KD at 1mb resolution (Figures 1C, S2C). We found that more interactions were lost than gained in the EWS/FLI containing states (Figure 1D) and that the lost interactions were significantly larger than gained interactions (Figures 1E, S2D). Example genomic regions are shown in Figures 1F and S2E. Similar changes to loop lengths for higher order chromatin interactions were observed by Jansz et al. upon depletion of Smchd1 in mouse neural stem cells, where Smchd1 reduces long range interactions and increases short range interactions at 1mb resolution (58). Taken together, these data demonstrate that EWS/FLI plays a role in higher order chromatin organization in Ewing sarcoma by reducing long-range interactions between distant loci in favor of increasing shorter-range interactions between nearby loci.
Alterations in compartment structure associate highly with enhancer landscape and gene expression changes
The megabase scale changes identified in intra-chromosomal interactions suggest that these may impact large-scale chromatin organizational features, such as chromatin compartment organization. Principal component analysis (PCA) of Hi-C data has been previously shown to identify and distinguish chromatin regions into one of two compartmental states: compartment A (relatively transcriptionally active) and compartment B (relatively transcriptionally inactive) (59). To identify A and B compartmental organization for EF-Endo, EF-KD and EF-Rescue cells, PCA of the respective interaction profiles were performed at 20 kb resolution and the first principal component (PC1) values were assigned to each 20 kb region in the genome using the Homer package (34). Here, positive PC1 values assigned to a region indicate A compartmentalization and negative PC1 values indicate B compartmentalization. We found that the majority of compartmental assignments remained unchanged in the presence or absence of EWS/FLI, but small segments of the genome showed noticeable changes (red highlights, Figure 2A). These findings were confirmed using Pearson correlation analyses (Supplementary Figure S3A) suggesting reorganization of compartments in shorter distance. We next identified shifting compartments between EF-WT and EF-KD states where regions that show a positive change in PC1 values (ΔPC1 ≥ 0.4) shift into a more ‘A-like’ compartment state while those that show a negative change in PC1 values (ΔPC1 ≤ –0.4) shift to a more ‘B-like’ compartment state. Overall, 10.4% (6.4% A-like and 4% B-like) and 8.7% (3.2% A-like and 5.5% B-like) of the genome showed altered compartments in EF-Endo versus EF-KD, and EF-Rescue versus EF-KD, respectively (Figures 2B, S3B). These results are consistent with similar comparative studies performed in non-Ewing context where majority of the genome do not shift compartments upon treatment (58,60).
Figure 2.

Alterations in compartment structure associate highly with enhancer landscape and gene expression changes. (A) Hi-C compartment profiles (PC1 values) for chromosome 2 show active (A, blue) and inactive (B, gray) compartments in EF-Endo, EF-KD and EF-Rescue. Highlighted regions show compartment alterations in EF-KD compared to EF-Endo and EF-Rescue. See also Supplementary Figure S3A. (B) Pie chart showing percentage of the genome undergoing compartment shifting in EF-Endo versus EF-KD. ΔPC1 = EF-Endo PC1 – EF-KD PC1. A-like shift, ΔPC1 ≥ 0.4; B-like shift, ΔPC1 ≤ –0.4. See also Supplementary Figure S3B. (C) Average log2 fold-change (log2FC) of gene expression at shifting compartments (EF-Endo versus EF-KD). Mean ± SEM shown. ****P value < 0.0001 (Games–Howell's multiple comparisons test). See also Supplementary Figure S3C and Table S19. (D) Violin plots showing log2FC enrichment of H3K27Ac at shifting compartments for EF-Endo versus EF-KD. ****P value < 0.0001 (Tukey's multiple comparisons test). Differential H3K27Ac binding analysis was performed using DiffBind and DeSeq2 R packages. See also Supplementary Figure S3D and Table S20. (E, F) Integrative genomics viewer (IGV) traces showing examples of compartment (E) activation (positive ΔPC1) and (F) inactivation (negative ΔPC1) in EF-Endo and EF-Rescue compared to EF-KD. Corresponding compartment profiles (PC1), enhancers (enhancer calls and H3K27Ac levels) and gene expression (RNA-seq) are also shown.
Although a majority of the genome do not show a shift in compartmentalization in our study, a small percentage of compartment shifting has been previously linked to gene expression changes in other studies involving chromatin compartments (60). We therefore asked whether the EWS/FLI-induced changes in compartmentalization were associated with gene expression and enhancer alterations. We compared previously-published RNA-seq and H3K27Ac CUT&Tag data in A673 cells (22,40) to our compartmental data, and found that genes that shifted in an A-like direction displayed significant increases in EWS/FLI mediated gene expression, while genes mapping to B-like shifts showed significant decreases in EWS/FLI mediated gene expression (Figures 2C, S3C). Genes in stable compartments demonstrated little change in gene expression. Similarly, H3K27Ac enrichment (a common marker of enhancers) was significantly increased with A-like compartmental shifts while H3K27Ac enrichment was significantly decreased with B-like compartmental shifts when compared to stable compartments (Figures 2D, S3D). Taken together, these results show that EWS/FLI-induced reorganization of chromatin to more active compartments are associated with gain of enhancers and upregulation of gene expression that can be appreciated at representative gene loci (Figure 2E). Conversely, EWS/FLI-induced compartment inactivation are associated with enhancer loss and downregulation of gene expression that can be similarly appreciated (Figure 2F).
EWS/FLI promotes active compartmentalization of chromatin at GGAA-μsats
We next hypothesized that EWS/FLI binding to chromatin might directly affect compartmental changes at EWS/FLI binding sites. To test this, we first developed a set of ‘high-confidence’ EWS/FLI binding sites by performing genome-wide localization studies for EWS/FLI in A673, TC71, SK-N-MC, and EWS-502 cells or the EWS/ERG fusion in TTC-466 cells using CUT&Tag (21). Principal component analysis (PCA) shows that EWS/FLI and EWS/ERG CUT&Tag replicates cluster together, while the corresponding IgG control replicates cluster separately from those of EWS/FLI and EWS/ERG (Supplementary Figure S4A). We identified 4658 overlapping regions, containing 5637 EWS/FLI peaks in A673, that were conserved across all five lines (Supplementary Figure S4B). The conserved EWS/FLI peaks in A673 cells were used in all subsequent analyses as a ‘high-confidence’ peak set. Motif analysis of these peaks showed GGAA-μsats and conserved ETS sequences as the top enriched motifs (Supplementary Figure S4C), as anticipated, thus confirming the quality of this dataset. Peak traces show highly conserved chromatin localization profiles for EWS/FLI and EWS/ERG in all five cell lines (Figure 3A) at both GGAA-μsats (Supplementary Figure S4D) and conventional ETS sites (Supplementary Figure S4E). Analysis of EWS/FLI enrichment showed that enhancers that were gained in EF-WT (as compared to EF-KD) had significantly higher EWS/FLI enrichment as compared to stable or lost enhancers, supporting the previously reported role of EWS/FLI in activating enhancers (Figures 3B, S5A, S5B) (15).
Figure 3.

EWS/FLI promotes active compartmentalization of chromatin at GGAA-μsats. (A) Representative example of EWS/FLI and EWS/ERG localization in 5 Ewing sarcoma cell lines (TTC-466, A673, TC71, SK-N-MC and EWS-502) over a 157 kb region of chromosome 19. Tracks represent log2 ratio of EWS/FLI or EWS/ERG versus IgG signal. (B) Boxplots showing EWS/FLI enrichment in A673 cells at differential enhancer regions in EF-Endo versus EF-KD. ****P value < 0.0001 (Tukey's multiple comparisons test). See also Supplementary Figures S5A, S5B and Table S10. (C) Doughnut chart showing proportion of EWS/FLI occupancy in A673 cells at shifting compartment regions between EF-Endo and EF-KD. See also Supplementary Figure S5C. (D, F, H) Plots of average PC1 values within 50 kb of EWS/FLI binding sites in EF-Endo, EF-KD, and EF-Rescue. (D) All conserved EWS/FLI binding sites in A673 cells. (F) EWS/FLI GGAA-μsat binding sites. (H) EWS/FLI non-μsat binding sites. (E, G, I) Bar charts showing average PC1 values in EF-Endo, EF-KD and EF-Rescue for 20kb regions overlapping EWS/FLI peaks. (E) All conserved EWS/FLI binding sites in A673. (G) GGAA-μsat binding sites. (I) Non-μsat binding sites. Mean ± SEM shown. **** P value < 0.0001 (Tukey's multiple comparisons test). See also Supplementary Table S21. (J, K) IGV traces showing EWS/FLI binding in A673 cells with corresponding compartment profiles, H3K27Ac levels, enhancer calls, and gene expression in EF-Endo, EF-KD and EF-Rescue. (J) Compartment activation and (K) Compartment inactivation in EF-Endo and EF-Rescue compared to EF-KD. See also Supplementary Figures S5D and S5E.
To evaluate the relationship between EWS/FLI binding and compartmental shifts, we annotated each conserved EWS/FLI peak to its corresponding compartmental segment in the genome. We found that 86.7% of EWS/FLI peaks bound to stable compartments (including both A and B compartments that remained stable), while 12.4% bound to A-like and only 0.9% bound to B-like compartment shifts in EF-Endo versus EF-KD (Figure 3C). Similar results were observed for EF-Rescue versus EF-KD (Supplementary Figure S5C). These results point to a possible direct role for a subset of EWS/FLI bound sites in compartment activation, but rarely in compartment inactivation. We therefore analysed the distribution of average PC1 values (i.e. compartmentalization) within 50 kb of EWS/FLI binding sites in EF-Endo, EF-KD and EF-Rescue to interrogate the direct role of EWS/FLI in compartmental shifting. These data demonstrated that EWS/FLI binding was associated with significant compartment activation (demonstrated as an increase in PC1 values) in both EF-Endo and EF-Rescue compared to EF-KD, with little difference in PC1 values between EF-Endo and EF-Rescue (Figure 3D, E). Most of the compartment activation at EWS/FLI binding sites were associated with EWS/FLI bound at GGAA-μsats (Figure 3F, G), with no statistically-significant difference observed at non-μsat sites (Figure 3H, I). Representative loci demonstrate compartment activation mediated by EWS/FLI binding, with associated enhancer formation and upregulation of gene expression (Figures 3J, S5D). Conversely, representative loci demonstrate compartment inactivation, associated with loss of enhancers and decreased gene expression (Figures 3K, S5E). These data support a model in which EWS/FLI binding to GGAA-μsats induces new enhancer formation, more active compartmentalization of chromatin (A-like shift), and subsequent upregulation of target genes genome-wide. Conversely, these data suggest that EWS/FLI seldom has a direct effect on inducing B-like compartment shifts and associated gene repression genome-wide.
EWS/FLI perturbs TAD boundaries
Changes in chromatin features demonstrated by alterations to compartments and megabase scale interactions next prompted us to evaluate the effect of EWS/FLI on sub-megabase TAD structures. TADs are highly self-interacting genomic regions that are bounded by boundary regions commonly enriched for CCCTC binding factor (CTCF) (49,61). Alterations to CTCF binding have been previously shown to disrupt TAD boundaries (62,63). To determine the effects of EWS/FLI on TAD organization, we identified TADs and TAD boundary regions in EF-Endo, EF-KD and EF-Rescue using the iHiC and TopDom packages (43,47). We found that ∼80% (6129) of TAD boundaries were conserved across the three conditions (stable boundaries) while only ∼4% (306) of boundaries were specific to EF-KD and ∼5.8% (441) of boundaries were specific to both the EF-WT conditions (Figure 4A). Although the majority of the TAD boundaries remained unaltered, we sought to understand whether EWS/FLI is involved in altering CTCF binding at the altered boundary regions. We performed CUT&Tag for CTCF in EF-Endo, EF-KD and EF-Rescue cells. PCA plot of PC2 versus PC1 for CTCF CUT&Tag replicates show very similar clustering of EF-Endo, EF-KD and EF-Rescue replicates, away from IgG replicates, suggesting little change in CTCF binding between the three conditions (Supplementary Figure S6A). Heatmap analysis of CTCF binding sites at boundary regions also showed that CTCF occupancy was largely unchanged between EF-Endo, EF-KD and EF-Rescue at all TAD boundaries (stable, EF-WT and EF-KD; Supplementary Figure S6B). Additionally, evaluation of CTCF peak tracks also showed similar CTCF localization in EF-Endo, EF-KD and EF-Rescue (Supplementary Figures S6C–E).
Figure 4.

EWS/FLI perturbs TAD boundaries. (A) UpSet plot showing overlap of TAD boundaries in EF-Endo, EF-KD and EF-Rescue. TAD boundaries were identified as 20kb regions that allow minimal contact between upstream and downstream regions compared to its neighboring regions (P value < 0.05). (B) Boxplots showing EWS/FLI enrichment at EF-KD, EF-WT and stable boundaries in A673. **** P value < 0.0001, ** P value < 0.01 (Tukey's multiple comparisons test).See also Supplementary Table S22. (C) Heatmap and profile plots showing localization of EWS/FLI, CTCF and cohesin subunits (SMC1A and Rad21) at EWS/FLI binding sites near EF-WT boundaries. (D) Example of EF-WT (dashed orange box) and stable boundaries (dashed black boxes) over a 1.4 mb region in chromosome 2. Heatmaps show Hi-C interactions for EF-Endo, EF-KD and EF-Rescue. Intensity of red spots correspond to contact frequency. TAD calls are depicted using maroon horizontal bars where a break corresponds to a TAD boundary. EWS/FLI, CTCF, and cohesin (SMC1A and Rad21) localization are also shown. See also Supplementary Figures S7A and S7B. (E) Directionality statistic (DS) calculated for 20 kb upstream (right panel) and downstream (left panel) of EWS/FLI binding site (orange dashed box) in EF-Endo, EF-KD and EF-Rescue using diffHiC R package. Positive and negative signs reflect the preference for downstream and upstream interactions of the target bin. The absolute value of DS reflects the magnitude of interaction directionality. See also Supplementary Figures S7C and S7D.
Conservation of CTCF binding at stable and altered TAD boundaries suggested a CTCF-independent role in the boundary perturbations we observed in A673 Ewing sarcoma cells. We therefore investigated whether EWS/FLI itself was involved in directly altering TAD boundaries. We found that EWS/FLI enrichment was significantly higher at EF-WT boundaries as compared to stable and EF–KD boundaries (Figure 4B), suggesting a role for EWS/FLI enrichment in formation of TAD boundaries. We identified 103 conserved EWS/FLI binding sites near 65 of the EF-WT boundaries and sought to examine whether EWS/FLI co-localizes with CTCF (a common barrier element) and/or cohesin (a loop extrusion factor) at these sites. Here, we sourced ChIP-sequencing data for cohesin subunits SMC1A and Rad21 from Surdez et al. and SMC1A ChIP-sequencing data from Adane et al. (37,38). Heatmap analysis and profile plots at the conserved EWS/FLI sites near EF-WT boundaries demonstrate co-localization of EWS/FLI with cohesin subunits SMC1A and Rad21, but not CTCF (Figure 4C). Examination of representative EF-WT boundaries occupied by EWS/FLI (dashed orange box) showed boundary formation in both EF-Endo and EF-Rescue, as compared to EF-KD as shown by Hi-C heatmaps and TAD calls (Figures 4D, S7A, S7B). Directionality statistic (DS), a measure of the direction and size of the interaction preference calculated for 20 kb regions adjacent to EWS/FLI binding sites, showed higher absolute values, but in opposite directions, for each 20 kb region in EF-Endo and EF-Rescue as compared to EF-KD (Figures 4E, S7C, S7D), suggesting a barrier function, similar to that of CTCF, for EWS/FLI at these sites (48,49). Furthermore, we detect cohesin (SMC1A and Rad21), but not CTCF occupancy at these EWS/FLI-specific boundaries, while both CTCF and cohesin binding clearly demarks the nearby stable boundaries (dashed black boxes) that interact with the EWS/FLI-specific boundary to form new TAD structures (Figures 4D, S7A, S7B). These data suggest a novel role for EWS/FLI in insulating chromatin interactions, independently of CTCF, to promote TAD boundaries, possibly by acting as a barrier element to cohesin mediated loop extrusion at specific loci.
EWS/FLI mediates chromatin looping
Identification of EWS/FLI at TAD boundaries and in changing directionality of interactions suggested that EWS/FLI might reorganize chromatin looping in Ewing sarcoma. We identified changes in chromatin looping at a high resolution (20 kb bins) between EF-WT and EF-KD cells. We found 1608 gained and 3878 lost loops in EF-Endo versus EF-KD (Figure 5A) and 706 gained and 2066 lost loops in EF-Rescue versus EF-KD (Supplementary Figure S8A). Comparison of these data to the differential enhancer analysis above (Supplementary Figure S5A) revealed that gained enhancers showed significant increases in loop enrichment, while lost enhancers showed significant decreases in loop enrichment, supporting a strong association between enhancer establishment and loop enrichment (Figures 5B, S8B). Annotation of differential loops to genes within 20 kb of loop anchors demonstrated that lost loops are strongly associated with downregulation of gene expression (Figures 5C, S8C), while gained loops associate strongly with upregulation of gene expression (Figures 5D, S8D).
Figure 5.

EWS/FLI mediates chromatin looping. (A) Volcano plot of differential interactions (DI) identified at 20 kb resolution in EF-Endo versus EF-KD A673 cells using diffHiC. DI, FDR < 0.05 and |fold change| > 4. See also Supplementary Figure S8A. (B) Average logFC enrichment of all 20 kb loops at differential enhancers for EF-Endo versus EF-KD. Mean ± SEM are shown. **** P value < 0.0001 (Tukey's multiple comparisons test). See also Supplementary Figures S5A, S8B and Table S26. (C, D) Volcano plots of differential gene expression for genes mapping to anchors of (C) lost (FDR < 0.05 & fold change < –4) and (D) gained (FDR < 0.05 and fold change > 4) interactions at 20 kb resolution in EF-Endo versus EF-KD. Significantly altered genes (red dots): Adjusted P value (P-adj) < 0.05 and |fold change (FC)| > 1.25. See also Supplementary Figure S8C and D. (E) Top motif enriched at anchors of gained interactions at 20 kb resolution for EF-Endo and EF-Rescue compared to EF-KD. P values for enriched motifs were identified by comparing to matched, randomized background regions using Homer motif analysis. (F) Average logFC enrichment of all interactions at 20 kb resolution in EF-Endo versus EF-KD associated with an EWS/FLI binding site (+) or no EWS/FLI binding site (–). Mean ± SEM shown. **** P value < 0.0001 (unpaired t-test). See also Supplementary Figure S8E and Table S24. (G) Average logFC (EF-Endo versus EF-KD) enrichment of interactions at 20kb resolution associated with the type of EWS/FLI binding site at each loop anchor. EFBS = EWS/FLI binding site, a1 = first anchor of a loop, a2 = second anchor of a loop, MS = GGAA-μsat bound EWS/FLI, NMS = non-μsat bound EWS/FLI. Mean ± SEM shown. **** P value < 0.0001 (Games-Howell's multiple comparisons test). See also Supplementary Figure S8F and Table S25. (H) Bar chart showing proportion of EWS/FLI bound inter- and intra-TAD gained loops in categories i and ii (MS/MS and MS/NMS) at 20 kb resolution (EF-Endo versus EF-KD) compared to control set of loops randomly picked from all interactions at 20 kb resolution. One-sample proportion test used to test for equal proportions of inter-TAD loops in categories i & ii versus the control set of loops. See also Supplementary Figure S8G. (I, J, K) Heatmaps showing localization of EWS/FLI, CTCF and cohesin subunits (SMC1A and Rad21) at (I) conserved EWS/FLI binding sites, (J) CTCF binding sites and (K) SMC1A binding sites near gained loop anchors (EF-Endo versus EF-KD). See also Supplementary Figure S9. (L) Examples of inter-TAD (tan) and intra-TAD (purple) gained interactions at 20 kb resolution. Corresponding TAD calls (black bars), conserved EWS/FLI localization, CTCF localization and cohesin (SMC1A and Rad21) localization shown. All ChIP-sequencing tracks are accompanied by their corresponding input tracks. See also Supplementary Figure S10.
To identify features that promote looping in EF-WT cells, we performed motif analysis of gained loops and found GGAA-μsats as the top enriched motif (Figure 5E), suggesting a direct role for EWS/FLI bound GGAA-μsats in mediating chromatin looping. To determine whether EWS/FLI binding to chromatin promotes loop enrichment, we compared the fold change of all 20 kb interactions either with or without a conserved EWS/FLI peak at an anchor. DNA bound by EWS/FLI showed significantly higher loop enrichment compared to DNA with no EWS/FLI (Figures 5F, S8E), supporting a direct role for EWS/FLI in mediating loop formation.
To interrogate the effect of EWS/FLI specific binding site on loop formation, we sub-categorized EWS/FLI bound loops into five categories: (i) GGAA-μsat bound EWS/FLI at both loop anchors (MS/MS); (ii) GGAA-μsat bound EWS/FLI at one anchor and non-μsat bound EWS/FLI at the other anchor (MS/NMS); (iii) GGAA-μsat bound EWS/FLI at one anchor only (MS/–); (iv) non-μsat bound EWS/FLI at both anchors (NMS/NMS); (v) non-μsat bound EWS/FLI at one anchor only (NMS/–). Loops in categories (i) and (ii) showed significantly higher enrichment compared to loops in any of the other categories (Figures 5G, S8F), supporting the notion that GGAA-μsat bound EWS/FLI promotes looping to other EWS/FLI bound sites.
To determine whether EWS/FLI mediated chromatin loops are insulated within TADs, we next identified 143 significantly gained loops (FDR < 0.05, fold change > 4) in EF-Endo versus EF-KD, and 43 significantly gained loops in EF-Rescue versus EF-KD in categories (i) and (ii) combined and compared these to TAD regions. We found 92 [64%] (and 28 [65%]) intra-TAD loops, and 51 [36%] (and 15 [35%]) inter-TAD loops in EF-Endo versus EF-KD (and EF-Rescue versus EF-KD; Figures 5H, S8G).To investigate whether these loops show a higher proportion of inter-TAD looping than expected, we randomly picked 1000 sets of 1000 loops from all 20kb interactions, and used the average as a control for the expected inter-TAD loop proportion in a one-sample proportion test. The results demonstrate that the proportion of inter-TAD loops in categories i & ii was significantly greater than the proportion of inter-TAD loops in the control set of loops (Figures 5H, S8G). These data not only suggest a direct role for EWS/FLI in formation of loops within TADs, but also indicates that EWS/FLI bound GGAA-μsats bypass TAD boundaries to interact with other EWS/FLI bound loci at a greater frequency than the background rate in Ewing sarcoma cells.
We next sought to investigate the relationship between EWS/FLI, CTCF and cohesin at all gained loops. We identified all EWS/FLI, CTCF and cohesin binding sites near gained loop anchors and performed heatmap and profile plot analysis for each type of binding site near both inter- and intra-TAD gained loop anchors (Figures 5I–K, S9A–E). We observed strong co-localization of cohesin subunits SMC1A and Rad21 with both EWS/FLI and CTCF binding sites (Figures 5I, J, S9A, S9B, S9D, S9E). Pearson correlation analysis demonstrated a significant positive correlation between EWS/FLI and SMC1A binding at EWS/FLI binding sites (Supplementary Figure S9F) and between CTCF and SMC1A binding at CTCF binding sites (Supplementary Figure S9G). Conversely, we observed a weak co-localization of EWS/FLI with CTCF at both EWS/FLI and CTCF binding sites near gained loop anchors (Figures 5I, J, S9A, S9B, S9D, S9E). Interrogation of SMC1A binding sites near gained loop anchors for EWS/FLI and CTCF localization demonstrated an exclusionary binding pattern between EWS/FLI and CTCF at SMC1A binding sites (Figures 5K, S9C). Moreover, a significant negative correlation was found between EWS/FLI and CTCF at all SMC1A binding sites near gained loop anchors (Supplementary Figure S9H). These data demonstrate that in spite of a weak EWS/FLI co-localization at CTCF sites (Figures 5J–K and S9B–C), there is a tendency for conserved EWS/FLI sites to be distinct from CTCF occupancy (at both inter- and intra-TAD gained loops; Figures 5I and S9A), while both EWS/FLI and CTCF associate with cohesin at their respective binding sites. These results suggest that, similarly to its role in EF-WT boundaries, EWS/FLI may act as a barrier element to extrusion of chromatin loops by cohesin to facilitate both inter- and intra-TAD loops (Figures 5L, S10).
Previous work demonstrated an association between GGAA-μsat length and gene expression, and suggested an optimal length of 18–26 total GGAA repeats for GGAA-μsats in both EWS/FLI binding and gene expression (12,64–66). We therefore asked whether similar correlations exist with EWS/FLI mediated looping. We performed Spearman's rank analysis and found significant positive correlations between GGAA-μsat length and loop enrichment for both total and consecutive GGAA repeats (Supplementary Figures S11A–D). Proportionality testing between GGAA-μsats of varied lengths demonstrated that longer length GGAA-μsats (≥11 for total and ≥ 6 for consecutive) associated significantly with increased percentage of gained loops compared to shorter length GGAA-μsats (<11 for total and <6 for consecutive) (Figures 6A, B, S11E, S11F; Tables S27, S28). We also observed an optimal GGAA length trend for EWS/FLI mediated loop enrichment around 18–26 total GGAA repeats, consistent with prior observations (12,64–66), with regards to endogenous EWS/FLI (Supplementary Figure S11A, loess regression line; Supplementary Figure S11G; Table S29), which was not prominent in the rescue study (Supplementary Figure S11B, loess regression line; Supplementary Figure S11H; Table S29), likely due to incomplete rescue, and thus fewer number of gained loops overall.
Figure 6.

EWS/FLI mediated gained loops associate with longer length GGAA-μsats. (A) Bar charts showing proportion of gained and lost interactions (EF-Endo versus EF-KD) at 20 kb resolution mapping to number of total GGAA motifs (sequence between two GGAA motifs ≤ 20 bp). See also Supplementary Figure S11E. (B) Bar charts showing proportion of gained and lost interactions (EF-Endo versus EF-KD) at 20kb resolution mapping to number of consecutive GGAA motifs (sequence between two GGAA motifs = 0 bp). See also Supplementary Figure S11F. (C, D) Examples showing (C) gained (purple) and (D) lost (blue) loops in EF-Endo versus EF-KD and EF-Rescue versus EF-KD. Corresponding EWS/FLI localization (CUT&Tag) in A673, enhancers, compartment profiles (PC1) and gene expression (RNA-seq) in EF-Endo, EF-KD and EF-Rescue are also shown. See also Supplementary Figure S12A and B.
These results demonstrate that EWS/FLI promotes novel chromatin loops that are strongly associated with longer length GGAA-μsats, enhancer activation, and upregulation of gene expression (Figures 6C, S12A). Lost loops, however, do not generally associate with EWS/FLI binding, but still show strong association with enhancer loss and downregulation of gene expression (Figures 6D, S12B).
Cell-specific local chromatin structure affects gene regulation
Multiple studies have previously identified putative EWS/FLI target genes (8,19,67–69). These studies, however, lacked genome-wide chromatin loop data associated with EWS/FLI to accurately annotate target genes to specific EWS/FLI bound regulatory elements. We therefore sought to define a set of ‘direct EWS/FLI target genes’ as those with (i) transcription start sites (TSS) either within 20 kb of an EWS/FLI binding site or overlapping an EWS/FLI-bound gained loop anchor (20 kb resolution), and (ii) differential expression in EF-Endo versus EF-KD in A673 cells. Using previously published RNA-sequencing data in A673 cells, we identified 4648 genes in total that are differentially expressed in EF-Endo versus EF-KD, with more genes downregulated than upregulated, as reported in previous studies (Supplementary Figure S13A) (8,19,56,67–69). We next identified differentially expressed genes that are under the direct control of EWS/FLI either via proximal EWS/FLI binding or via long distance looping as described above. We found 707 target genes to be directly upregulated and 339 target genes to be directly downregulated by EWS/FLI using this approach (Supplementary Tables S30 and S31). While analysis of RNA-seq data only indicates that EWS/FLI induces repression of more genes than activation, combining differential gene expression data to conserved EWS/FLI binding and chromatin looping data reveal that GGAA-μsat bound EWS/FLI has a more prominent role as a direct transcriptional activator than repressor: 324 genes directly upregulated versus 49 genes directly downregulated. Conversely, non-μsat bound EWS/FLI was found to play a more equal role in both activation and repression of genes by directly upregulating 383 genes, and directly downregulating 290 genes.
With the inclusion of EWS/FLI mediated chromatin loops, we identified 193 genes that are dysregulated by a conserved EWS/FLI peak associated with a gained loop in EF-Endo versus EF-KD. These include genes that were previously shown to be EWS/FLI responsive and play important roles in tumor growth and/or metastasis in Ewing sarcoma, such as NKX2-2 (8,15), PPP1R1A (70), HOXD13 (71), FEZF1 (11,72), CCND1 (15,73) and CAV1 (74). We also identified target genes that code for surface proteins, such as SLC24A3, NTNG1, LINGO1 and PAPPA, reported as potential candidates for antibody-mediated therapies in Ewing sarcoma (75,76). Additionally, we identified novel target genes of various functions that require further research to delineate their roles in Ewing sarcoma development and progression, including targets such as NKX2-4, involved in cell differentiation and regulation of transcription (77); POU1F1, involved in breast cancer progression (78); OLFM3, involved in embryonic development and tumor growth (79); ARX, involved in CNS development (80) and IGSF10, involved in neuronal migration (81). A complete list of these target genes are provided in Supplementary Table S32.
To investigate whether EWS/FLI directly regulates similar target genes in an alternate Ewing sarcoma cell line, we knocked-down EWS/FLI in TC71 cells and performed RNA-seq for EWS/FLI WT (EF-Endo) and EWS/FLI knock-down (EF-KD) TC71 cells (Supplementary Figures S13B–E). PCA revealed strong clustering of RNA-seq replicates in the first principal component (PC1) axis (79% of the variance in the data; Supplementary Figure S13F). Upon differential gene expression analysis, we found that the total number of genes regulated by EWS/FLI in TC71 was lower than in A673 (2179 versus 4648, respectively; Supplementary Figure S13G versus S13A), likely due to the less efficient depletion of EWS/FLI (compare Supplementary Figure S13B to Figure S1A). GSEA analysis using the direct up- and down-regulated gene sets in A673 showed significant enrichment for the same genes in TC71 cells (NES = +2.76 and –2.16 for up- and down-regulated gene sets, respectively), demonstrating that many genes are regulated similarly by EWS/FLI in both cell lines (Supplementary Figure S14A, B). However, we also observed a critical direct target gene in A673, NKX2-2, that was regulated differently in TC71.
In A673, depletion of EWS/FLI results in depletion of NKX2-2 expression and loss of oncogenesis (8), but not in TC71 (Figure 7A). Since EWS/FLI localization is conserved between A673 and TC71 at the NKX2-2 locus (Figure 7B), we asked whether heterogeneity in regulation was a result of altered chromatin structure between the two cell lines. Hi-C data in A673 showed EWS/FLI bound GGAA-μsat looping to NKX2-2 to regulate gene expression (Figure 7B). We therefore performed 4C experiments to compare the local chromatin structure of TC71 and A673 cells at the NKX2-2 locus, using the right most GGAA-μsat (RMS) as the viewpoint (Figure 7C). We observed high interaction intensity, possibly within an insulated domain in both A673 and TC71, beyond which interaction intensity drops (boundary highlighted in yellow). However, in A673, the intensity of interactions at this boundary is much depleted compared to TC71, allowing EWS/FLI to significantly interact near NKX2-2 in A673 (black boxes). No significant interactions between RMS and NKX2-2 were detected in TC71, suggesting direct EWS/FLI regulation of NKX2-2 in A673 but not in TC71. We next performed CTCF CUT&Tag in TC71 cells to compare CTCF localization between A673 and TC71 at this locus. PCA showed strong clustering of CTCF CUT&Tag replicates in both EF-Endo and EF-KD, away from IgG controls (Supplementary Figure S14C). CTCF localization, in combination with 4C data (Figure 7B and C), showed increased insulation of EWS/FLI interactions at the CTCF peak upstream of the NKX2-2 locus (highlighted in yellow) in TC71, which is largely absent in A673, allowing EWS/FLI bound GGAA-μsat to loop to NKX2-2 in EF-Endo and EF-Rescue A673 cells. These data demonstrate that local chromatin structure, such as CTCF localization and chromatin loop formation, may account for differences in EWS/FLI mediated gene regulation in different Ewing sarcoma cell lines and tumors, a proposed mechanism of which is shown in Figure 7D.
Figure 7.

Cell-specific local chromatin structure affects gene regulation. (A) Normalized NKX2-2 expression counts from differential gene expression analysis in A673 and TC71 EF-Endo versus EF-KD cells. Significant, adjusted P value (P-adj) < 0.05. (B, C) Regulation of NKX2-2 by EWS/FLI in A673 compared to TC71. (B) IGV images showing gained loops at 20 kb resolution for EF-Endo versus EF-KD and EF-Rescue versus EF-KD in A673 (purple). CUT&Tag data showing EWS/FLI and CTCF occupancy at the NKX2-2 locus in A673 and TC71. RNA sequencing traces show gene expression for EF-Endo, EF-KD and EF-Rescue in A673 and EF-Endo and EF-KD in TC71. (C) 4C data showing significant interactions (in red) (P value < 0.05) with the viewpoint (region of interest; RMS = right GGAA-μsat) in A673 and TC71. (D) Schematic showing altered local chromatin structure as a proposed mechanism of gene regulation heterogeneity in different Ewing sarcoma cell lines.
DISCUSSION
Our study of 3D chromatin organization revealed a novel role for EWS/FLI in reprogramming higher order chromatin interactions, A/B compartments, TAD boundaries, and enhancer-promoter type chromatin loops in patient derived Ewing sarcoma cells. Chromatin changes that occur upon depletion of EWS/FLI can be largely reversed by re-expression of the ‘rescue’ EWS/FLI, providing evidence for EWS/FLI mediated remodeling of 3D chromatin that has significant transcriptional consequence in Ewing sarcoma. We highlight a role for EWS/FLI bound GGAA-μsats in directly anchoring chromatin loops (both inter- and intra-TAD loops) and TAD boundaries. EWS/FLI binding to GGAA-μsats also promotes active compartmentalization of chromatin and has a strong looping preference for other EWS/FLI bound DNA. This in turn may promote active compartmentalization of DNA interacting with GGAA-μsat bound EWS/FLI, thus upregulating gene expression within these compartments.
Recent research suggest that depletion of STAG2 (a subunit of the cohesin ring complex) alters cohesin mediated extrusion of CTCF-anchored loops in Ewing sarcoma, a mechanism by which a subset of EWS/FLI-bound enhancers can also undergo chromatin looping to alter gene expression (37,38). Cohesin is proposed to extrude and expand chromatin loops, a process that can be hindered by boundary factors such as CTCF to mark TAD boundaries (82). Our results suggest that a similar mechanism is in play at EWS/FLI mediated TAD boundaries and gained loops, whereby cohesin may be recruited and/or stalled at EWS/FLI specific TAD boundaries and loop anchors either by EWS/FLI itself or by some other barrier factor associated with EWS/FLI at these sites. Moreover, identification of cohesin at both inter- and intra-TAD loops mediated by EWS/FLI in our study suggests a role for cohesin mediated loop extrusion in promoting nested loops at EWS/FLI sites. The phase separation property of the EWS portion of EWS/FLI is necessary to bind GGAA-μsat DNA and recruit other factors to these sites. This property of EWS/FLI maybe important for cohesin recruitment, and/or stalling, at EWS/FLI barrier sites, but proof of this role will require additional study. Investigation into the mechanisms of cohesin dynamics at EWS/FLI binding sites are also necessary to better understand the role of the EWS/FLI chimera as a barrier element in chromatin looping and TAD boundaries.
Past and current work have shown that more genes are downregulated than upregulated in the presence of EWS/FLI in Ewing sarcoma (8,69). In line with this observation, several studies show direct mechanisms for EWS/FLI in transcriptional repression (15,83). In contrast, our research provides evidence for indirect modes of chromatin restructuring by EWS/FLI, such as compartment inactivation and loop loss, that are directly associated with enhancer loss and gene repression. This suggests involvement of factors, other than EWS/FLI, in enhancer depletion, loop loss, compartment inactivation, and gene repression. It is therefore important to interrogate these regulatory regions to identify critical factors involved in gene repression and to understand the role of EWS/FLI in indirectly promoting such repressive chromatin states in Ewing sarcoma.
EWS/FLI alters the transcriptome by directly regulating hundreds of genes, which in turn leads to dysregulation of thousands of downstream targets, leading to oncogenesis. Hence, identification of high confidence direct EWS/FLI target genes is crucial to define the primary set of genes that initiate this transcriptional mayhem in Ewing sarcoma. Using EWS/FLI mediated chromatin looping data and a list of high confidence EWS/FLI peaks, we fill a significant knowledge gap in Ewing sarcoma by directly annotating EWS/FLI-bound regulatory elements to target genes that trigger this wide range of transcriptional alteration. Our list of direct EWS/FLI target genes is however, limited by the resolution of Hi-C experiments as well as the reference genome used. Publicly available reference genomes do not include structural and small variants present in cancer cells (84,85). Existence of any such variants at repetitive GGAA-μsats in Ewing sarcoma cells would be of great consequence to EWS/FLI binding, enhancer establishment, A/B compartmentalization, and chromatin looping. Hence, construction of custom reference genomes along with higher resolution looping data for each cell line are necessary to accurately identify the complete set of direct EWS/FLI target genes in Ewing sarcoma.
Although we used a highly conserved set of EWS/FLI binding sites in multiple cell lines to identify direct EWS/FLI target genes in A673 cells, we detected heterogeneity in regulation of a direct target gene, NKX2-2, in two distinct patient derived Ewing sarcoma cell lines (A673 and TC71). NKX2-2 was first published as a target gene of EWS/FLI in Smith et al. (8). However, reporter assays conducted by the authors using the promoter region of NKX2-2 in human embryonic kidney cells failed to identify NKX2-2 as a direct target of EWS/FLI. Moreover, Kinsey et al. also did not find NKX2-2 to be commonly regulated in multiple Ewing sarcoma cell lines, suggesting that NKX2-2 was not a direct EWS/FLI target gene (19). However, in our study we see clear evidence of NKX2-2 being directly targeted by EWS/FLI in A673 cells via looping (Figure 7B), which was also reported by Riggi et al. by 3C (chromatin conformation capture) (15). Finally, when we incorporated looping data to TC71 cell (Figure 7C) we found that NKX2-2 is not a direct target of EWS/FLI in TC71 Ewing sarcoma cells, suggesting that cell line specific chromatin conformation can help identify direct target genes specific to the cell line that might not have been identified by other means. These data suggest that factors other than EWS/FLI localization are in play in promoting altered regulation of gene expression. GGAA-μsat polymorphisms have been previously linked to altered gene expression and disease susceptibility in Ewing sarcoma (65,86). Here we show that heterogenous regulation of genes in different Ewing sarcoma cells may also occur as a result of altered local chromatin structure, suggesting that such disparity in chromatin organization may also effect disease susceptibility, clinical presentation, therapeutic response, and patient outcomes.
In conclusion, our study demonstrates that the EWS/FLI fusion transcription factor plays a significant role in altering transcription through chromatin reorganization in Ewing sarcoma. It is therefore likely that other similar fusion oncoproteins found in different cancers may also be involved in reorganization of chromatin to promote oncogenesis. In fact, recent research show that the NUP98-HOXA9 oncogenic fusion transcription factor, found in leukemias, can undergo phase transition and promote chromatin looping to regulate gene expression and oncogenesis (87). Our results therefore demonstrate a significant role for a fusion transcription factor in directly reprogramming the 3D chromatin landscape to dysregulate the transcriptional state in a fusion mediated cancer.
DATA AVAILABILITY
All RNA-seq, CUT&Tag, processed ChIP-seq, 4C, and in situ Hi-C data generated in this study have been deposited at GEO under accession number GSE185132 (reviewer token: gzcvcuycvpwjrex). A673 RNA-seq and H3K27Ac CUT&Tag data were obtained from our previously published data (GSE160898: GSM4885656, GSM4885661, GSM4885657, GSM4885662, GSM4885658, GSM4885663; GSE144688: GSM4292892, GSM4292893, GSM4292898, GSM4292899, GSM4292900, GSM4292901, GSM4292906, GSM4292907, GSM4292908, GSM4292909, GSM4292914, GSM4292915). SMC1A and Rad21 ChIP-sequencing data were downloaded from Adane et al. (2021) and Surdez et al. (2021) (GSE116495: GSM5049898, GSM5049902; GSE133154:GSM3901161, GSM3901162, GSM3901163).
Genome browser tracks are available at the following URLs: A/B Compartments: https://genome.ucsc.edu/s/rsixs001/A673_Compartments_HiC. EWS/FLI and EWS/ERG CUT&Tag: https://genome.ucsc.edu/s/rsixs001/EWSFLI_EWSERG_CUT%26Tag. A673 H3K27Ac CUT&Tag: https://genome.ucsc.edu/s/rsixs001/A673_H3K27Ac_CUT%26Tag. A673 CTCF CUT&Tag: https://genome.ucsc.edu/s/rsixs001/A673_CTCF_CUT%26Tag. TC71 CTCF CUT&Tag: https://genome.ucsc.edu/s/rsixs001/TC71_CTCF_CUT%26Tag. Cohesin ChIP-seq: https://genome.ucsc.edu/s/rsixs001/A673_cohesin_ChIPseq. A673 RNAseq: https://genome.ucsc.edu/s/rsixs001/A673_RNAseq. TC71 RNAseq: https://genome.ucsc.edu/s/rsixs001/TC71_RNAseq.
All software used in this study are available as listed: ImageJ 1.51j8 (https://imagej.nih.gov/ij/), IGV v2.6.2 (https://software.broadinstitute.org/software/igv/), GraphPad Prism v9.0.0 (www.graphpad.com), FASTQC v0.11.4 (https://www.bioinformatics.babraham.ac.uk/projects/fastqc/), TrimGalore v0.4.4_dev (https://www.bioinformatics.babraham.ac.uk/projects/trim_galore/), Bowtie2 v2.3.4.3 and v2.4.1 (https://github.com/BenLangmead/bowtie2), SAMTools v1.9 (https://github.com/samtools/samtools), DESeq2 v1.26.0 (https://bioconductor.org/packages/release/bioc/html/DESeq2.html), R v4.0.0 (https://cran.r-project.org/), deepTools v3.4.3 (https://deeptools.readthedocs.io/en/develop/index.html), MACS v 2.2.7.1 (https://pypi.org/project/MACS2/), DiffBind v2.14.0 (https://bioconductor.org/packages/release/bioc/html/DiffBind.html), IDR v 2.0.3 (https://github.com/nboley/idr), ChIPpeakAnno v3.24.2 (http://bioconductor.org/packages/release/bioc/html/ChIPpeakAnno.html), GenomicRanges v1.42.0 (https://bioconductor.org/packages/release/bioc/html/GenomicRanges.html), UpSetR_v1.4.0 (https://cran.r-project.org/web/packages/UpSetR/index.html), Homer package v4.11.1 (motif analysis, http://homer.ucsd.edu/homer/motif/index.html; HiC analysis, http://homer.ucsd.edu/homer/interactions2/index.html), ROSE (http://younglab.wi.mit.edu/super_enhancer_code.html), Sambamba v0.7.1 (https://github.com/biod/sambamba), bbduk v37.64 (https://github.com/BioInfoTools/BBMap), STAR version 2.6.0c (https://github.com/alexdobin/STAR), Arima Genomics Mapping pipeline (https://github.com/ArimaGenomics/mapping_pipeline), BWA-MEM (https://github.com/lh3/bwa), Picard Tools v2.20.3 (https://github.com/broadinstitute/picard), iHiC pipeline (https://github.com/hugangqing/iHiC), Juicer (https://github.com/aidenlab/juicer), Juicebox v1.9.8 (https://github.com/aidenlab/Juicebox), BEDTools v.2.29.2 (https://bedtools.readthedocs.io/en/latest/), TopDom v0.0.2 (https://github.com/HenrikBengtsson/TopDom), diffHiC v1.22.0 (https://bioconductor.org/packages/release/bioc/html/diffHic.html), edgeR v3.32.1 (https://bioconductor.org/packages/release/bioc/html/edgeR.html), Limma v3.46.0 (https://bioconductor.org/packages/release/bioc/html/limma.html), EnhancedVolcano v1.8.0 (https://bioconductor.org/packages/release/bioc/html/EnhancedVolcano.html), GSEA v4.0.3 (https://www.gsea-msigdb.org/gsea/index.jsp), Pipe4C v1.00 (https://github.com/deLaatLab/pipe4C), BSgenome.Hsapiens.UCSC.hg19 v1.4.3 (https://bioconductor.org/packages/release/data/annotation/html/BSgenome.Hsapiens.UCSC.hg19.html), PeakC v0.2 (https://github.com/deWitLab/peakC).
All codes used in this study are available on Mendeley Data: https://data.mendeley.com/datasets/xpbxbzy4th/draft?a=fd59ec1d-e039-46c4-9828-509a3dffe40b.
Supplementary Material
ACKNOWLEDGEMENTS
We thank Ali Snedden and Yuan Zhang for support with high performance computing; Institute for Genomic Medicine at Nationwide Children's Hospital for sequencing and bioinformatics support; Steven Henikoff Laboratory for their generous donation of Tn5 reagent for CUT ; Benjamin Stanton, Benjamin Sunkel, Jack Tokarsky, and Andrea Byrum for helpful comments and discussion.
Notes
Present address: Megann A. Boone, West Virginia University School of Medicine, Morgantown, WV 26505, USA.
Present address: Jesse C. Crow, Forge Biologics, Grove City, OH 43123, USA.
Contributor Information
Iftekhar A Showpnil, Center for Childhood Cancer and Blood Diseases, Abigail Wexner Research Institute at Nationwide Children's Hospital, Columbus, OH 43205, USA; Molecular, Cellular, and Developmental Biology Graduate Program, The Ohio State University, Columbus, OH 43210, USA.
Julia Selich-Anderson, Center for Childhood Cancer and Blood Diseases, Abigail Wexner Research Institute at Nationwide Children's Hospital, Columbus, OH 43205, USA.
Cenny Taslim, Center for Childhood Cancer and Blood Diseases, Abigail Wexner Research Institute at Nationwide Children's Hospital, Columbus, OH 43205, USA.
Megann A Boone, Center for Childhood Cancer and Blood Diseases, Abigail Wexner Research Institute at Nationwide Children's Hospital, Columbus, OH 43205, USA; Biomedical Sciences Graduate Program, The Ohio State University, Columbus, OH 43210, USA.
Jesse C Crow, Center for Childhood Cancer and Blood Diseases, Abigail Wexner Research Institute at Nationwide Children's Hospital, Columbus, OH 43205, USA.
Emily R Theisen, Center for Childhood Cancer and Blood Diseases, Abigail Wexner Research Institute at Nationwide Children's Hospital, Columbus, OH 43205, USA; Molecular, Cellular, and Developmental Biology Graduate Program, The Ohio State University, Columbus, OH 43210, USA; Biomedical Sciences Graduate Program, The Ohio State University, Columbus, OH 43210, USA; Department of Pediatrics, The Ohio State University, Columbus, OH 43210, USA.
Stephen L Lessnick, Center for Childhood Cancer and Blood Diseases, Abigail Wexner Research Institute at Nationwide Children's Hospital, Columbus, OH 43205, USA; Molecular, Cellular, and Developmental Biology Graduate Program, The Ohio State University, Columbus, OH 43210, USA; Biomedical Sciences Graduate Program, The Ohio State University, Columbus, OH 43210, USA; Department of Pediatrics, The Ohio State University, Columbus, OH 43210, USA; Division of Pediatric Heme/Onc/BMT, The Ohio State University College of Medicine, Columbus, OH 43210, USA.
SUPPLEMENTARY DATA
Supplementary Data are available at NAR Online.
FUNDING
National Institutes of Health [U54 CA231641 to S.L.L.]. Funding for open access charge: National Institutes of Health [U54 CA231641].
Conflict of interest statement. S.L.L. declares competing interests as a member of the scientific advisory board for Salarius Pharmaceuticals with financial holdings and receipt of consultation fees. S.L.L. is also a listed inventor on United States Patent No. US 7,939,253 B2, ‘Methods and compositions for the diagnosis and treatment of Ewing's sarcoma,’ and United States Patent No. US 8,557,532, ‘Diagnosis and treatment of drug-resistant Ewing's sarcoma.’ E.R.T. receives research funding from Salarius Pharmaceuticals. This support is unrelated to the data presented in this manuscript.
REFERENCES
- 1. Sankar S., Lessnick S.L.. Promiscuous partnerships in Ewing's sarcoma. Cancer Genet. 2011; 204:351–365. [DOI] [PMC free article] [PubMed] [Google Scholar]
- 2. Delattre O., Zucman J., Plougastel B., Desmaze C., Melot T., Peter M., Kovar H., Joubert I., Jongt P.D., Rouleau G.et al.. Gene fusion with an ETS DNA-binding domain caused by chromosome translocation in human tumours. Nature. 1992; 359:162–165. [DOI] [PubMed] [Google Scholar]
- 3. Boone M.A., Taslim C., Crow J.C., Selich-Anderson J., Watson M., Heppner P., Hamill J., Wood A.C., Lessnick S.L., Winstanley M.. Identification of a novel FUS/ETV4 fusion and comparative analysis with other Ewing sarcoma fusion proteins. Mol. Cancer Res. 2021; 19:1795–1801. [DOI] [PMC free article] [PubMed] [Google Scholar]
- 4. Seth A., Watson D.K.. ETS transcription factors and their emerging roles in human cancer. Eur. J. Cancer. 2005; 41:2462–2478. [DOI] [PubMed] [Google Scholar]
- 5. Schwartz J.C., Cech T.R., Parker R.R.. Biochemical properties and biological functions of FET proteins. Annu. Rev. Biochem. 2015; 84:355–379. [DOI] [PMC free article] [PubMed] [Google Scholar]
- 6. Turc-Carel C., Philip I., Berger M., Philip T., Lenoir G.M.. Chromosome study of Ewing's sarcoma (ES) cell lines. Consistency of a reciprocal translocation t(11;22)(q24;q12). Cancer Genet. Cytogenet. 1984; 12:1–19. [DOI] [PubMed] [Google Scholar]
- 7. Turc-Carel C., Aurias A., Mugneret F., Lizard S., Sidaner I., Volk C., Thiery J.P., Olschwang S., Philip I., Berger M.P.et al.. Chromosomes in Ewing's sarcoma. I. an evaluation of 85 cases and remarkable consistency of t(11;22)(q24;q12). Cancer Genet. Cytogenet. 1988; 32:229–238. [DOI] [PubMed] [Google Scholar]
- 8. Smith R., Owen L.A., Trem D.J., Wong J.S., Whangbo J.S., Golub T.R., Lessnick S.L.. Expression profiling of EWS/FLI identifies NKX2.2 as a critical target gene in Ewing's sarcoma. Cancer Cell. 2006; 9:405–416. [DOI] [PubMed] [Google Scholar]
- 9. May A.W., Gishizky M.L., Lessnick S.L., Lunsford L.B., Lewis B.C., Delattre O., Zucman J., Thomas G., Denny C.T.. Ewing sarcoma 11;22 translocation produces a chimeric transcription factor that requires the DNA-binding domain encoded by FLII for transformation. Proc. Natl. Acad. Sci. U.S.A. 1993; 90:5752–5756. [DOI] [PMC free article] [PubMed] [Google Scholar]
- 10. May W.A., Lesnick S.L., Braun B.S., Klemsz M., Lewis B.C., Lunsford L.B., Hromas R., Denny C.T.. The Ewing's sarcoma EWS/FLI-1 fusion gene encodes a more potent transcriptional activator and is a more powerful transforming gene than FLI-1. Mol. Cell. Biol. 1993; 7393–7398. [DOI] [PMC free article] [PubMed] [Google Scholar]
- 11. Gangwal K., Sankar S., Hollenhorst P.C., Kinsey M., Haroldsen S.C., Shah A.A., Boucher K.M., Watkins W.S., Jorde L.B., Graves B.J.et al.. Microsatellites as EWSFLI response elements in Ewing's sarcoma. Proc. Natl. Acad. Sci. U.S.A. 2008; 105:10149–10154. [DOI] [PMC free article] [PubMed] [Google Scholar]
- 12. Johnson K.M., Mahler N.R., Saund R.S., Theisen E.R., Taslim C., Callender N.W., Crow J.C., Miller K.R., Lessnick S.L.. Role for the EWS domain of EWS/FLI in binding GGAA-microsatellites required for Ewing sarcoma anchorage independent growth. Proc. Nat. Acad. Sci. U.S.A. 2017; 114:9870–9875. [DOI] [PMC free article] [PubMed] [Google Scholar]
- 13. Boulay G., Volorio A., Iyer S., Broye L.C., Stamenkovic I., Riggi N., Rivera M.N.. Epigenome editing of microsatellite repeats defines tumor-specific enhancer functions and dependencies. Genes Dev. 2018; 32:1008–1019. [DOI] [PMC free article] [PubMed] [Google Scholar]
- 14. Kwon I., Kato M., Xiang S., Wu L., Theodoropoulos P., Mirzaei H., Han T., Xie S., Corden J.L., McKnight S.L.. Phosphorylation-regulated binding of RNA polymerase II to fibrous polymers of low-complexity domains. Cell. 2013; 155:1049–1060. [DOI] [PMC free article] [PubMed] [Google Scholar]
- 15. Riggi N., Knoechel B., Gillespie S.M., Rheinbay E., Boulay G., Suva M.L., Rossetti N.E., Boonseng W.E., Oksuz O., Cook E.B.et al.. EWS-FLI1 utilizes divergent chromatin remodeling mechanisms to directly activate or repress enhancer elements in Ewing sarcoma. Cancer Cell. 2014; 26:668–681. [DOI] [PMC free article] [PubMed] [Google Scholar]
- 16. Boulay G., Sandoval G.J., Riggi N., Iyer S., Buisson R., Naigles B., Awad M.E., Rengarajan S., Volorio A., McBride M.J.et al.. Cancer-Specific retargeting of BAF complexes by a prion-like domain. Cell. 2017; 171:163–178. [DOI] [PMC free article] [PubMed] [Google Scholar]
- 17. Chong S., Dugast-Darzacq C., Liu Z., Dong P., Dailey G.M., Cattoglio C., Heckert A., Banala S., Lavis L., Darzacq X.et al.. Imaging dynamic and selective low-complexity domain interactions that control gene transcription. Science. 2018; 361:2555. [DOI] [PMC free article] [PubMed] [Google Scholar]
- 18. Rao S.S., Huntley M.H., Durand N.C., Stamenova E.K., Bochkov I.D., Robinson J.T., Sanborn A.L., Machol I., Omer A.D., Lander E.S.et al.. A 3D map of the human genome at kilobase resolution reveals principles of chromatin looping. Cell. 2014; 159:1665–1680. [DOI] [PMC free article] [PubMed] [Google Scholar]
- 19. Kinsey M., Smith R., Lessnick S.L.. NR0B1 is required for the oncogenic phenotype mediated by EWS/FLI in Ewing's sarcoma. Mol. Cancer Res. 2006; 4:851–859. [DOI] [PubMed] [Google Scholar]
- 20. Bustin S.A., Benes V., Garson J.A., Hellemans J., Huggett J., Kubista M., Mueller R., Nolan T., Pfaffl M.W., Shipley G.L.et al.. The MIQE guidelines: minimum information for publication of quantitative real-time PCR experiments. Clin. Chem. 2009; 55:611–622. [DOI] [PubMed] [Google Scholar]
- 21. Kaya-Okur H.S., Wu S.J., Codomo C.A., Pledger E.S., Bryson T.D., Henikoff J.G., Ahmad K., Henikoff S.. CUT&Tag for efficient epigenomic profiling of small samples and single cells. Nat. Commun. 2019; 10:1930. [DOI] [PMC free article] [PubMed] [Google Scholar]
- 22. Theisen E.R., Selich-Anderson J., Miller K.R., Tanner J.M., Taslim C., Pishas K.I., Sharma S., Lessnick S.L.. Chromatin profiling reveals relocalization of lysine-specific demethylase 1 by an oncogenic fusion protein. Epigenetics. 2020; 16:405–424. [DOI] [PMC free article] [PubMed] [Google Scholar]
- 23. Langmead B., Wilks C., Antonescu V., Charles R.. Scaling read aligners to hundreds of threads on general-purpose processors. Bioinformatics. 2019; 35:421–432. [DOI] [PMC free article] [PubMed] [Google Scholar]
- 24. Langmead B., Salzberg S.L.. Fast gapped-read alignment with bowtie 2. Nat. Methods. 2012; 9:357–359. [DOI] [PMC free article] [PubMed] [Google Scholar]
- 25. Danecek P., Bonfield J.K., Liddle J., Marshall J., Ohan V., Pollard M.O., Whitwham A., Keane T., McCarthy S.A., Davies R.M.et al.. Twelve years of SAMtools and BCFtools. Gigascience. 2021; 10:giab008. [DOI] [PMC free article] [PubMed] [Google Scholar]
- 26. Love M.I., Huber W., Anders S.. Moderated estimation of fold change and dispersion for RNA-seq data with DESeq2. Genome Biol. 2014; 15:550. [DOI] [PMC free article] [PubMed] [Google Scholar]
- 27. Ramirez F., Ryan D.P., Gruning B., Bhardwaj V., Kilpert F., Richter A.S., Heyne S., Dundar F., Manke T.. deepTools2: a next generation web server for deep-sequencing data analysis. Nucleic Acids Res. 2016; 44:W160–W165. [DOI] [PMC free article] [PubMed] [Google Scholar]
- 28. Zhang Y., Liu T., Meyer C.A., Eeckhoute J., Johnson D.S., Bernstein B.E., Nusbaum C., Myers R.M., Brown M., Li W.et al.. Model-based analysis of chip-Seq (MACS). Genome Biol. 2008; 9:R137. [DOI] [PMC free article] [PubMed] [Google Scholar]
- 29. Ross-Innes C.S., Stark R., Teschendorff A.E., Holmes K.A., Ali H.R., Dunning M.J., Brown G.D., Gojis O., Ellis I.O., Green A.R.et al.. Differential oestrogen receptor binding is associated with clinical outcome in breast cancer. Nature. 2012; 481:389–393. [DOI] [PMC free article] [PubMed] [Google Scholar]
- 30. Li Q., Brown J.B., Huang H., Bickel P.J.. Measuring reproducibility of high-throughput experiments. Ann. Appl. Stat. 2011; 5:1752–1779. [Google Scholar]
- 31. Zhu L.J., Gazin C., Lawson N.D., Pagès H., Lin S.M., Lapointe D.S., Green M.R.. ChIPpeakAnno: a bioconductor package to annotate chip-seq and chip-chip data. BMC Bioinf. 2010; 11:237. [DOI] [PMC free article] [PubMed] [Google Scholar]
- 32. Lawrence M., Huber W., Pages H., Aboyoun P., Carlson M., Gentleman R., Morgan M.T., Carey V.J.. Software for computing and annotating genomic ranges. PLoS Comput. Biol. 2013; 9:e1003118. [DOI] [PMC free article] [PubMed] [Google Scholar]
- 33. Lex A., Gehlenborg N., Strobelt H., Vuillemot R., Pfister H.. UpSet: visualization of intersecting sets. IEEE Trans. Vis. Comput. Graph. 2014; 20:1983–1992. [DOI] [PMC free article] [PubMed] [Google Scholar]
- 34. Heinz S., Benner C., Spann N., Bertolino E., Lin Y.C., Laslo P., Cheng J.X., Murre C., Singh H., Glass C.K.. Simple combinations of lineage-determining transcription factors prime cis-regulatory elements required for macrophage and b cell identities. Mol. Cell. 2010; 38:576–589. [DOI] [PMC free article] [PubMed] [Google Scholar]
- 35. Whyte W.A., Orlando D.A., Hnisz D., Abraham B.J., Lin C.Y., Kagey M.H., Rahl P.B., Lee T.I., Young R.A.. Master transcription factors and mediator establish super-enhancers at key cell identity genes. Cell. 2013; 153:307–319. [DOI] [PMC free article] [PubMed] [Google Scholar]
- 36. Loven J., Hoke H.A., Lin C.Y., Lau A., Orlando D.A., Vakoc C.R., Bradner J.E., Lee T.I., Young R.A.. Selective inhibition of tumor oncogenes by disruption of super-enhancers. Cell. 2013; 153:320–334. [DOI] [PMC free article] [PubMed] [Google Scholar]
- 37. Surdez D., Zaidi S., Grossetete S., Laud-Duval K., Ferre A.S., Mous L., Vourc’h T., Tirode F., Pierron G., Raynal V.et al.. STAG2 mutations alter CTCF-anchored loop extrusion, reduce cis-regulatory interactions and EWSR1-FLI1 activity in Ewing sarcoma. Cancer Cell. 2021; 39:810–826. [DOI] [PubMed] [Google Scholar]
- 38. Adane B., Alexe G., Seong B.K.A., Lu D., Hwang E.E., Hnisz D., Lareau C.A., Ross L., Lin S., Cruz F.S.D.et al.. STAG2 loss rewires oncogenic and developmental programs to promote metastasis in Ewing sarcoma. Cancer Cell. 2021; 39:827–844. [DOI] [PMC free article] [PubMed] [Google Scholar]
- 39. Dobin A., Davis C.A., Schlesinger F., Drenkow J., Zaleski C., Jha S., Batut P., Chaisson M., Gingeras T.R.. STAR: ultrafast universal RNA-seq aligner. Bioinformatics. 2013; 29:15–21. [DOI] [PMC free article] [PubMed] [Google Scholar]
- 40. Boone M.A., Taslim C., Crow J.C., Selich-Anderson J., Byrum A.K., Showpnil I.A., Sunkel B.D., Wang M., Stanton B.Z., Theisen E.R.et al.. The FLI portion of EWS/FLI contributes a transcriptional regulatory function that is distinct and separable from its DNA-binding function in Ewing sarcoma. Oncogene. 2021; 40:4759–4769. [DOI] [PMC free article] [PubMed] [Google Scholar]
- 41. Li H., Durbin R.. Fast and accurate short read alignment with burrows-wheeler transform. Bioinformatics. 2009; 25:1754–1760. [DOI] [PMC free article] [PubMed] [Google Scholar]
- 42. Li H., Durbin R.. Fast and accurate long-read alignment with burrows-wheeler transform. Bioinformatics. 2010; 26:589–595. [DOI] [PMC free article] [PubMed] [Google Scholar]
- 43. Hu G. Methods in Molecular Biology: Stem Cell Transcriptional Networks. 2020; 65–78. [Google Scholar]
- 44. Heinz S., Texari L., Hayes M.G.B., Urbanowski M., Chang M.W., Givarkes N., Rialdi A., White K.M., Albrecht R.A., Pache L.et al.. Transcription elongation can affect genome 3D structure. Cell. 2018; 174:1522–1536. [DOI] [PMC free article] [PubMed] [Google Scholar]
- 45. Durand N.C., Shamim M.S., Machol I., Rao S.S., Huntley M.H., Lander E.S., Aiden E.L.. Juicer provides a one-click system for analyzing loop-resolution Hi-C experiments. Cell Syst. 2016; 3:95–98. [DOI] [PMC free article] [PubMed] [Google Scholar]
- 46. Durand N.C., Robinson J.T., Shamim M.S., Machol I., Mesirov J.P., Lander E.S., Aiden E.L.. Juicebox provides a visualization system for Hi-C contact maps with unlimited zoom. Cell Syst. 2016; 3:99–101. [DOI] [PMC free article] [PubMed] [Google Scholar]
- 47. Shin H., Shi Y., Dai C., Tjong H., Gong K., Alber F., Zhou X.J.. TopDom: an efficient and deterministic method for identifying topological domains in genomes. Nucleic Acids Res. 2016; 44:e70. [DOI] [PMC free article] [PubMed] [Google Scholar]
- 48. Lun A.T., Smyth G.K.. diffHic: a bioconductor package to detect differential genomic interactions in Hi-C data. BMC Bioinf. 2015; 16:258. [DOI] [PMC free article] [PubMed] [Google Scholar]
- 49. Dixon J.R., Selvaraj S., Yue F., Kim A., Li Y., Shen Y., Hu M., Liu J.S., Ren B.. Topological domains in mammalian genomes identified by analysis of chromatin interactions. Nature. 2012; 485:376–380. [DOI] [PMC free article] [PubMed] [Google Scholar]
- 50. Robinson M.D., McCarthy D.J., Smyth G.K.. edgeR: a bioconductor package for differential expression analysis of digital gene expression data. Bioinformatics. 2010; 26:139–140. [DOI] [PMC free article] [PubMed] [Google Scholar]
- 51. McCarthy D.J., Chen Y., Smyth G.K.. Differential expression analysis of multifactor RNA-Seq experiments with respect to biological variation. Nucleic Acids Res. 2012; 40:4288–4297. [DOI] [PMC free article] [PubMed] [Google Scholar]
- 52. Ritchie M.E., Phipson B., Wu D., Hu Y., Law C.W., Shi W., Smyth G.K.. limma powers differential expression analyses for RNA-sequencing and microarray studies. Nucleic Acids Res. 2015; 43:e47. [DOI] [PMC free article] [PubMed] [Google Scholar]
- 53. Mootha V.K., Lindgren C.M., Eriksson K., Subramanian A., Sihag S., Lehar J., Puigserver P., Carlsson E., Ridderstrale M., Laurila E.et al.. PGC-1α-responsive genes involved in oxidative phosphorylation are coordinately downregulated in human diabetes. Nat. Genet. 2003; 34:267–273. [DOI] [PubMed] [Google Scholar]
- 54. Subramanian A., Tamayo P., Mootha V.K., Mukherjee S., Ebert B.L., Gillette M.E., Paulovich A., Pomeroy S.L., Golub T.R., Lander E.S.et al.. Gene set enrichment analysis: a knowledge-based approach for interpreting genome-wide expression profiles. Proc. Natl Acad. Sci. U.S.A. 2005; 102:15545–15550. [DOI] [PMC free article] [PubMed] [Google Scholar]
- 55. Krijger P.H.L., Geeven G., Bianchi V., Hilvering C.R.E., de Laat W.. 4C-seq from beginning to end: a detailed protocol for sample preparation and data analysis. Methods. 2020; 170:17–32. [DOI] [PubMed] [Google Scholar]
- 56. Theisen E.R., Miller K.R., Showpnil I.A., Taslim C., Pishas K.I., Lessnick S.L.. Transcriptomic analysis functionally maps the intrinsically disordered domain of EWS/FLI and reveals novel transcriptional dependencies for oncogenesis. Genes Cancer. 2019; 10:21–38. [DOI] [PMC free article] [PubMed] [Google Scholar]
- 57. Martinez-Ramirez A., Rodriguez-Perales S., Melendez B., Martinez-Delgado B., Urioste M., Cigudosa J.C., Benitez J.. Characterization of the A673 cell line (Ewing tumor) by molecular cytogenetic techniques. Cancer Genet. Cytogenet. 2003; 138–142. [DOI] [PubMed] [Google Scholar]
- 58. Jansz N., Keniry A., Trussart M., Bildsoe H., Beck T., Tonks I.D., Mould A.W., Hickey P., Breslin K., Iminitoff M.et al.. Smchd1 regulates long-range chromatin interactions on the inactive x chromosome and at hox clusters. Nat. Struct. Mol. Biol. 2018; 25:766–777. [DOI] [PubMed] [Google Scholar]
- 59. Lieberman-Aiden E., Berkum N.L.V., Williams L., Imakaev M., Ragoczy T., Telling A., Amit I., Lajoie B.R., Sabo P.J., Dorschner M.O.et al.. Comprehensive mapping of long-range interactions reveals folding principles of the human genome. Science. 2009; 326:289–293. [DOI] [PMC free article] [PubMed] [Google Scholar]
- 60. Achinger-Kawecka J., Valdes-Mora F., Luu P.L., Giles K.A., Caldon C.E., Qu W., Nair S., Soto S., Locke W.J., Yeo-Teh N.S.et al.. Epigenetic reprogramming at estrogen-receptor binding sites alters 3D chromatin landscape in endocrine-resistant breast cancer. Nat. Commun. 2020; 11:320. [DOI] [PMC free article] [PubMed] [Google Scholar]
- 61. Nora E.P., Lajoie B.R., Schulz E.G., Giorgetti L., Okamoto I., Servant N., Piolot T., van Berkum N.L., Meisig J., Sedat J.et al.. Spatial partitioning of the regulatory landscape of the X-inactivation centre. Nature. 2012; 485:381–385. [DOI] [PMC free article] [PubMed] [Google Scholar]
- 62. Nora E.P., Goloborodko A., Valton A.L., Gibcus J.H., Uebersohn A., Abdennur N., Dekker J., Mirny L.A., Bruneau B.G.. Targeted degradation of CTCF decouples local insulation of chromosome domains from genomic compartmentalization. Cell. 2017; 169:930–944. [DOI] [PMC free article] [PubMed] [Google Scholar]
- 63. Sun J.H., Zhou L., Emerson D.J., Phyo S.A., Titus K.R., Gong W., Gilgenast T.G., Beagan J.A., Davidson B.L., Tassone F.et al.. Disease-associated short tandem repeats co-localize with chromatin domain boundaries. Cell. 2018; 175:224–238. [DOI] [PMC free article] [PubMed] [Google Scholar]
- 64. Zuo L., Zhang G., Massett M., Cheng J., Guo Z., Wang L., Gao Y., Li R., Huang X., Li P.et al.. Loci-specific phase separation of FET fusion oncoproteins promotes gene transcription. Nat. Commun. 2021; 12:1491. [DOI] [PMC free article] [PubMed] [Google Scholar]
- 65. Monument M.J., Johnson K.M., McIlvaine E., Abegglen L., Watkins W.S., Jorde L.B., Womer R.B., Beeler N., Monovich L., Lawlor E.R.et al.. Clinical and biochemical function of polymorphic NR0B1 GGAA-microsatellites in Ewing sarcoma: a report from the children's oncology group. PLoS One. 2014; 9:e104378. [DOI] [PMC free article] [PubMed] [Google Scholar]
- 66. Johnson K.M., Taslim C., Saund R.S., Lessnick S.L.. Identification of two types of GGAA-microsatellites and their roles in EWS/FLI binding and gene regulation in Ewing sarcoma. PLoS One. 2017; 12:e0186275. [DOI] [PMC free article] [PubMed] [Google Scholar]
- 67. Hancock J.D., Lessnick S.L.. A transcriptional profiling meta-analysis reveals a core EWS-FLI gene expression signature. Cell Cycle. 2008; 7:250–256. [DOI] [PubMed] [Google Scholar]
- 68. Aynaud M.M., Mirabeau O., Gruel N., Grossetete S., Boeva V., Durand S., Surdez D., Saulnier O., Zaidi S., Gribkova S.et al.. Transcriptional programs define intratumoral heterogeneity of Ewing sarcoma at single-cell resolution. Cell Rep. 2020; 30:1767–1779. [DOI] [PubMed] [Google Scholar]
- 69. Prieur A., Tirode F., Cohen P., Delattre O.. EWS/FLI-1 silencing and gene profiling of Ewing cells reveal downstream oncogenic pathways and a crucial role for repression of insulin-like growth factor binding protein 3. Mol. Cell Biol. 2004; 24:7275–7283. [DOI] [PMC free article] [PubMed] [Google Scholar]
- 70. Luo W., Xu C., Ayello J., Dela Cruz F., Rosenblum J.M., Lessnick S.L., Cairo M.S. Protein phosphatase 1 regulatory subunit 1A in Ewing sarcoma tumorigenesis and metastasis. Oncogene. 2018; 37:798–809. [DOI] [PubMed] [Google Scholar]
- 71. Apfelbaum A.A., Wu F., Hawkins A.G., Magnuson B., Jimenez J.A., Taylor S.D., Wrenn E.D., Waltner O., Pfaltzgraff E.R., Song J.Y.et al.. EWS-FLI1 and HOXD13 control tumor cell plasticity in Ewing sarcoma. Clin. Cancer Res. 2022; 10.1158/1078-0432.CCR-22-0384. [DOI] [PMC free article] [PubMed] [Google Scholar]
- 72. Garcia-Garcia L., Fernandez-Tabanera E., Cervera S.T., Melero-Fernandez de Mera R.M., Josa S., Gonzalez-Gonzalez L., Rodriguez-Martin C., Grunewald T.G.P., Alonso J.. The transcription factor FEZF1, a direct target of EWSR1-FLI1 in Ewing sarcoma cells, regulates the expression of neural-specific genes. Cancers (Basel). 2021; 13:5668. [DOI] [PMC free article] [PubMed] [Google Scholar]
- 73. Sanchez G., Delattre O., Auboeuf D., Dutertre M.. Coupled alteration of transcription and splicing by a single oncogene: boosting the effect on cyclin D1 activity. Cell Cycle. 2008; 7:2299–2305. [DOI] [PubMed] [Google Scholar]
- 74. Tirado O.M., Mateo-Lozano S., Villar J., Dettin L.E., Llort A., Gallego S., Ban J., Kovar H., Notario V.. Caveolin-1 (CAV1) is a target of EWS/FLI-1 and a key determinant of the oncogenic phenotype and tumorigenicity of Ewing's sarcoma cells. Cancer Res. 2006; 66:9937–9947. [DOI] [PubMed] [Google Scholar]
- 75. Town J., Pais H., Harrison S., Stead L.F., Bataille C., Bunjobpol W., Zhang J., Rabbitts T.H.. Exploring the surfaceome of Ewing sarcoma identifies a new and unique therapeutic target. Proc. Nat. Acad. Sci. U.S.A. 2016; 113:3603–3608. [DOI] [PMC free article] [PubMed] [Google Scholar]
- 76. Heitzeneder S., Sotillo E., Shern J.F., Sindiri S., Xu P., Jones R., Pollak M., Noer P.R., Lorette J., Fazli L.et al.. Pregnancy-associated plasma protein-A (PAPP-A) in Ewing sarcoma: role in tumor growth and immune evasion. J Natl Cancer Inst. 2019; 111:970–982. [DOI] [PMC free article] [PubMed] [Google Scholar]
- 77. Nagel S., Pommerenke C., Meyer C., MacLeod R.A.F.. NKL homeobox genes NKX2-3 and NKX2-4 deregulate megakaryocytic-erythroid cell differentiation in AML. Int J Mol Sci. 2021; 22:11434. [DOI] [PMC free article] [PubMed] [Google Scholar]
- 78. Martinez-Ordonez A., Seoane S., Avila L., Eiro N., Macia M., Arias E., Pereira F., Garcia-Caballero T., Gomez-Lado N., Aguiar P.et al.. POU1F1 transcription factor induces metabolic reprogramming and breast cancer progression via LDHA regulation. Oncogene. 2021; 40:2725–2740. [DOI] [PMC free article] [PubMed] [Google Scholar]
- 79. Jin Y., Li J.L.. Olfactomedin-like 3: possible functions in embryonic development and tumorigenesis. Chin. Med. J. (Engl.). 2019; 132:1733–1738. [DOI] [PMC free article] [PubMed] [Google Scholar]
- 80. Bienvenu T., Poirier K., Friocourt G., Bahi N., Beaumont D., Fauchereau F., Ben Jeema L., Zemni R., Vinet M.C., Francis F.et al.. ARX, a novel Prd-class-homeobox gene highly expressed in the telencephalon, is mutated in X-linked mental retardation. Hum. Mol. Genet. 2002; 11:981–991. [DOI] [PubMed] [Google Scholar]
- 81. Howard S.R., Guasti L., Ruiz-Babot G., Mancini A., David A., Storr H.L., Metherell L.A., Sternberg M.J., Cabrera C.P., Warren H.R.et al.. IGSF10 mutations dysregulate gonadotropin-releasing hormone neuronal migration resulting in delayed puberty. EMBO Mol. Med. 2016; 8:626–642. [DOI] [PMC free article] [PubMed] [Google Scholar]
- 82. Fudenberg G., Imakaev M., Lu C., Goloborodko A., Abdennur N., Mirny L.A.. Formation of chromosomal domains by loop extrusion. Cell Rep. 2016; 15:2038–2049. [DOI] [PMC free article] [PubMed] [Google Scholar]
- 83. Sankar S., Bell R., Stephens B., Zhuo R., Sharma S., Bearss D.J., Lessnick S.L.. Mechanism and relevance of EWS/FLI-mediated transcriptional repression in Ewing sarcoma. Oncogene. 2013; 32:5089–5100. [DOI] [PMC free article] [PubMed] [Google Scholar]
- 84. Futreal P.A., Coin L., Marshall M., Down T., Hubbard T., Wooster R., Rahman N., Stratton M.R.. A census of human cancer genes. Nat. Rev. Cancer. 2004; 4:177–183. [DOI] [PMC free article] [PubMed] [Google Scholar]
- 85. Ciriello G., Miller M.L., Aksoy B.A., Senbabaoglu Y., Schultz N., Sander C.. Emerging landscape of oncogenic signatures across human cancers. Nat. Genet. 2013; 45:1127–1133. [DOI] [PMC free article] [PubMed] [Google Scholar]
- 86. Grunewald T.G., Bernard V., Gilardi-Hebenstreit P., Raynal V., Surdez D., Aynaud M.M., Mirabeau O., Cidre-Aranaz F., Tirode F., Zaidi S.et al.. Chimeric EWSR1-FLI1 regulates the Ewing sarcoma susceptibility gene EGR2 via a GGAA microsatellite. Nat. Genet. 2015; 47:1073–1078. [DOI] [PMC free article] [PubMed] [Google Scholar]
- 87. Ahn J.H., Davis E.S., Daugird T.A., Zhao S., Quiroga I.Y., Uryu H., Li J., Storey A.J., Tsai Y.H., Keeley D.P.et al.. Phase separation drives aberrant chromatin looping and cancer development. Nature. 2021; 595:591–595. [DOI] [PMC free article] [PubMed] [Google Scholar]
Associated Data
This section collects any data citations, data availability statements, or supplementary materials included in this article.
Supplementary Materials
Data Availability Statement
All RNA-seq, CUT&Tag, processed ChIP-seq, 4C, and in situ Hi-C data generated in this study have been deposited at GEO under accession number GSE185132 (reviewer token: gzcvcuycvpwjrex). A673 RNA-seq and H3K27Ac CUT&Tag data were obtained from our previously published data (GSE160898: GSM4885656, GSM4885661, GSM4885657, GSM4885662, GSM4885658, GSM4885663; GSE144688: GSM4292892, GSM4292893, GSM4292898, GSM4292899, GSM4292900, GSM4292901, GSM4292906, GSM4292907, GSM4292908, GSM4292909, GSM4292914, GSM4292915). SMC1A and Rad21 ChIP-sequencing data were downloaded from Adane et al. (2021) and Surdez et al. (2021) (GSE116495: GSM5049898, GSM5049902; GSE133154:GSM3901161, GSM3901162, GSM3901163).
Genome browser tracks are available at the following URLs: A/B Compartments: https://genome.ucsc.edu/s/rsixs001/A673_Compartments_HiC. EWS/FLI and EWS/ERG CUT&Tag: https://genome.ucsc.edu/s/rsixs001/EWSFLI_EWSERG_CUT%26Tag. A673 H3K27Ac CUT&Tag: https://genome.ucsc.edu/s/rsixs001/A673_H3K27Ac_CUT%26Tag. A673 CTCF CUT&Tag: https://genome.ucsc.edu/s/rsixs001/A673_CTCF_CUT%26Tag. TC71 CTCF CUT&Tag: https://genome.ucsc.edu/s/rsixs001/TC71_CTCF_CUT%26Tag. Cohesin ChIP-seq: https://genome.ucsc.edu/s/rsixs001/A673_cohesin_ChIPseq. A673 RNAseq: https://genome.ucsc.edu/s/rsixs001/A673_RNAseq. TC71 RNAseq: https://genome.ucsc.edu/s/rsixs001/TC71_RNAseq.
All software used in this study are available as listed: ImageJ 1.51j8 (https://imagej.nih.gov/ij/), IGV v2.6.2 (https://software.broadinstitute.org/software/igv/), GraphPad Prism v9.0.0 (www.graphpad.com), FASTQC v0.11.4 (https://www.bioinformatics.babraham.ac.uk/projects/fastqc/), TrimGalore v0.4.4_dev (https://www.bioinformatics.babraham.ac.uk/projects/trim_galore/), Bowtie2 v2.3.4.3 and v2.4.1 (https://github.com/BenLangmead/bowtie2), SAMTools v1.9 (https://github.com/samtools/samtools), DESeq2 v1.26.0 (https://bioconductor.org/packages/release/bioc/html/DESeq2.html), R v4.0.0 (https://cran.r-project.org/), deepTools v3.4.3 (https://deeptools.readthedocs.io/en/develop/index.html), MACS v 2.2.7.1 (https://pypi.org/project/MACS2/), DiffBind v2.14.0 (https://bioconductor.org/packages/release/bioc/html/DiffBind.html), IDR v 2.0.3 (https://github.com/nboley/idr), ChIPpeakAnno v3.24.2 (http://bioconductor.org/packages/release/bioc/html/ChIPpeakAnno.html), GenomicRanges v1.42.0 (https://bioconductor.org/packages/release/bioc/html/GenomicRanges.html), UpSetR_v1.4.0 (https://cran.r-project.org/web/packages/UpSetR/index.html), Homer package v4.11.1 (motif analysis, http://homer.ucsd.edu/homer/motif/index.html; HiC analysis, http://homer.ucsd.edu/homer/interactions2/index.html), ROSE (http://younglab.wi.mit.edu/super_enhancer_code.html), Sambamba v0.7.1 (https://github.com/biod/sambamba), bbduk v37.64 (https://github.com/BioInfoTools/BBMap), STAR version 2.6.0c (https://github.com/alexdobin/STAR), Arima Genomics Mapping pipeline (https://github.com/ArimaGenomics/mapping_pipeline), BWA-MEM (https://github.com/lh3/bwa), Picard Tools v2.20.3 (https://github.com/broadinstitute/picard), iHiC pipeline (https://github.com/hugangqing/iHiC), Juicer (https://github.com/aidenlab/juicer), Juicebox v1.9.8 (https://github.com/aidenlab/Juicebox), BEDTools v.2.29.2 (https://bedtools.readthedocs.io/en/latest/), TopDom v0.0.2 (https://github.com/HenrikBengtsson/TopDom), diffHiC v1.22.0 (https://bioconductor.org/packages/release/bioc/html/diffHic.html), edgeR v3.32.1 (https://bioconductor.org/packages/release/bioc/html/edgeR.html), Limma v3.46.0 (https://bioconductor.org/packages/release/bioc/html/limma.html), EnhancedVolcano v1.8.0 (https://bioconductor.org/packages/release/bioc/html/EnhancedVolcano.html), GSEA v4.0.3 (https://www.gsea-msigdb.org/gsea/index.jsp), Pipe4C v1.00 (https://github.com/deLaatLab/pipe4C), BSgenome.Hsapiens.UCSC.hg19 v1.4.3 (https://bioconductor.org/packages/release/data/annotation/html/BSgenome.Hsapiens.UCSC.hg19.html), PeakC v0.2 (https://github.com/deWitLab/peakC).
All codes used in this study are available on Mendeley Data: https://data.mendeley.com/datasets/xpbxbzy4th/draft?a=fd59ec1d-e039-46c4-9828-509a3dffe40b.