Figure 1.
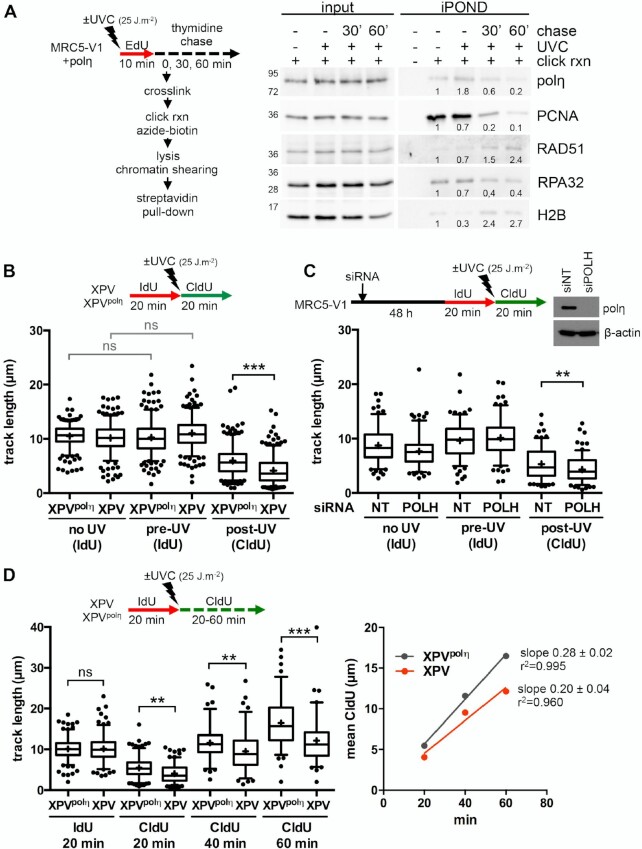
Polη promotes replication fork progression after UV. (A) MRC5-V1 cells stably expressing polη were irradiated or not with UVC (25 J m–2) and pulse-labelled with 10 μM EdU for 10 min. Cells were cross-linked immediately after the pulse or after a 30- or 60-min thymidine chase. Biotin was conjugated to EdU by click chemistry (click rxn) prior to cell lysis and chromatin shearing. Labelled DNA was retrieved on streptavidin beads and input and bound proteins (iPOND) were analysed by western blot using the indicated antibodies. iPOND band intensity was corrected by the corresponding input band intensity and expressed as a ratio of the mock-treated condition. An independent experiment is shown in Supplementary Figure S1A. (B) XPV cells and their corrected counterpart (XPVpolη) were irradiated or not at 25 J m–2 between 20-min pulses of IdU and CldU. DNA was spread on glass slides and IdU, CldU and total DNA were detected by immunofluorescence. Replicated tracks were measured on unbroken bicolor signals (1 of 3 independent experiments, n = 300, box-plot with interquartile range and 5–95 percentile whiskers, +: mean of the distribution, dots: outliers, Kruskal-Wallis followed by Dunn's multiple comparisons test, ns: not significant, ***P < 0.001). (C) MRC5-V1 cells were depleted for polη using siRNAs and treated like in B (1 of 2 independent experiments, n = 150, Mann–Whitney test, siNT: non specific siRNA, siPOLH: siRNA against POLH mRNAs). siPOLH efficiency was confirmed by western blot. (D) XPV and XPVpolη cells were treated as in B but with a CldU pulse of 20, 40 or 60 min. Left panel shows the distributions of IdU and CldU tracks (n > 90, Kruskal-Wallis followed by Dunn's multiple comparisons test, ns: not significant, **P < 0.01, ***P < 0.001). Right panel shows the linear regression of the mean CldU calculated from these distributions. Slopes and r2 coefficients are indicated.

