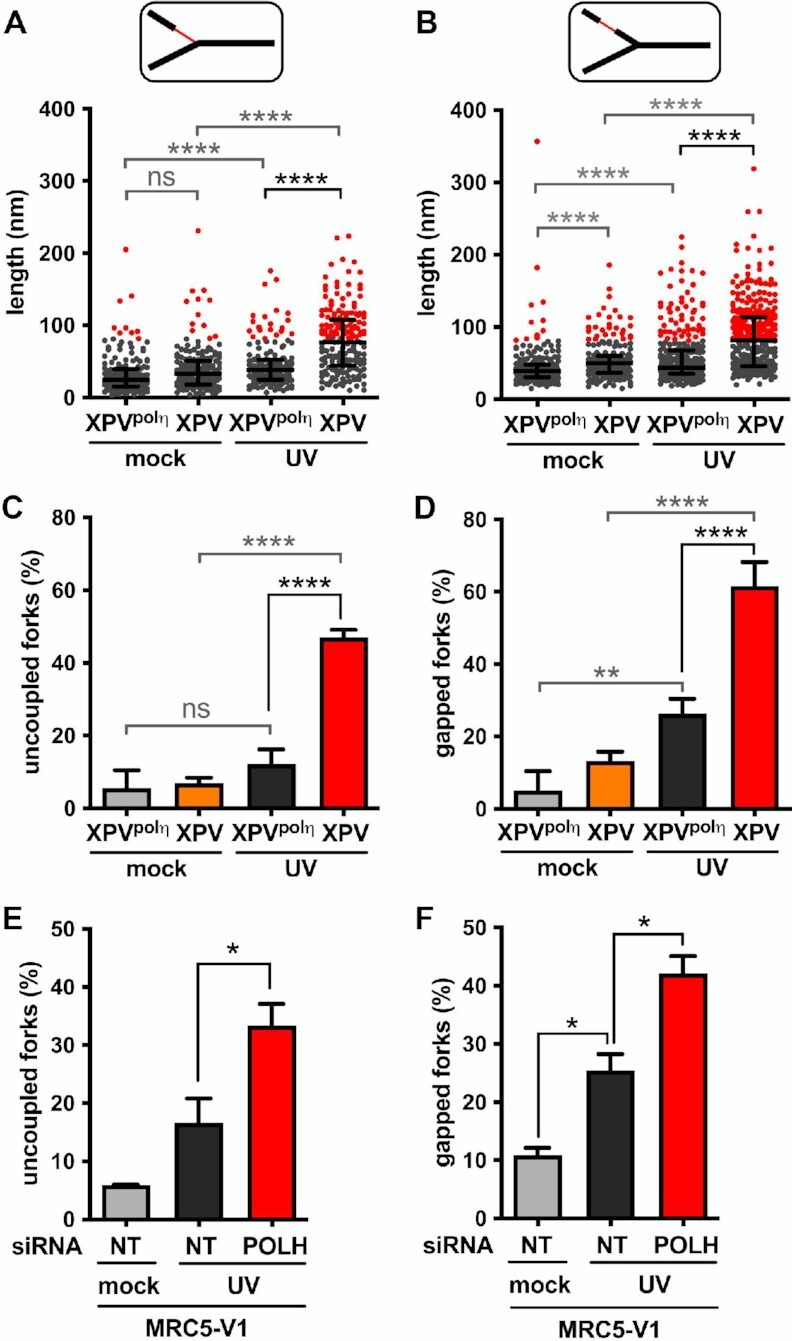
Figure 3.

Polη prevents accumulation of ssDNA at and behind the elongation point after UV. TEM analysis was performed in XPV and XPVpolη cells 30 min after UVC irradiation at 25 J m–2 in three independent experiments. For each condition, at least 50 forks were analysed per experiment. (A) Distribution of the lengths of the ssDNA regions located at RFs (pool from the three experiments, n > 160). (B) Distribution of the lengths of the ssDNA regions located behind RFs. Data are shown as dot plots with median and interquartile range. Statistical significance was tested by Kruskal-Wallis followed by Dunn's multiple comparisons test (ns: not significant, ****P < 0.0001). The 95th percentiles of the distributions of untreated XPVpolη cells (81.55 and 81.25 nm at and behind RFs, respectively) were used as thresholds to identify abnormally long ssDNA stretches at and behind the elongation point (red dots in the graphes). (C) The number of uncoupled RFs (i.e. bearing a ssDNA stretch above the threshold at the elongation point) was expressed as a percentage of total RFs analysed. (D) The number of gapped RFs (i.e. bearing at least a ssDNA gap above the threshold behind the elongation point) was expressed as a percentage of total RFs analysed. Values are the mean ± SD of the three independent experiments. Statistical significance was tested by ordinary one-way ANOVA followed by Tukey's multiple comparisons test (ns: not significant *P < 0.05, **P < 0.01, ****P < 0.0001). (E) Proportion of uncoupled forks and (F) proportion of gapped forks were determined as described above in MRC5-V1 cells depleted or not for polη (N = 2).
