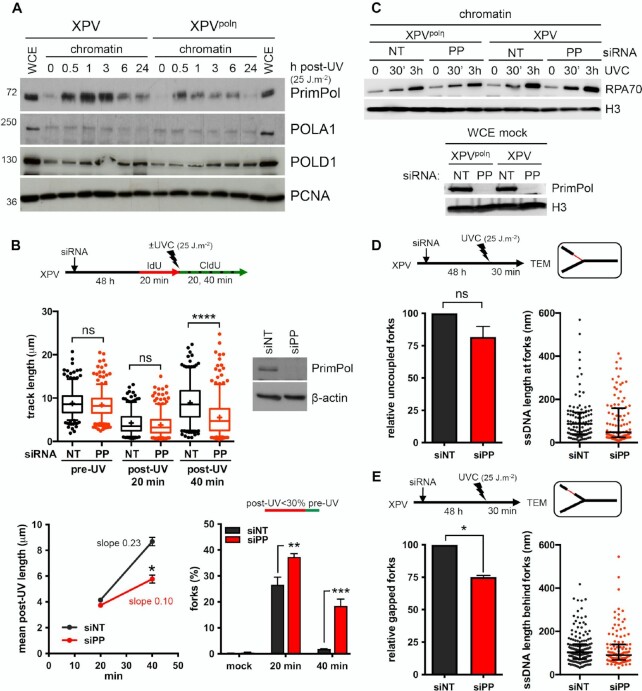
Figure 4.
PrimPol depletion further reduces replication track length and impacts on RI architecture in irradiated XPV cells. (A) Cellular fractionation was performed at the indicated time points following UVC irradiation at 25 J m–2 in XPV and XPVpolη cells (N = 3). Whole cell extracts (WCE) of unirradiated cells and chromatin-bound proteins were analysed by western blot using the indicated antibodies. (B) XPV cells were depleted for PrimPol (PP) and DNA fiber assay was performed as described in Figure 1D. Upper panel show the distributions of replication track length (n > 300, Kruskal-Wallis followed by Dunn's multiple comparisons test, ns: not significant, ***P < 0.001, ns: not significant; **P < 0.01, ****P < 0.0001). siPRIMPOL efficiency was confirmed by western blot. An independent experiment was performed with CldU and IdU as pre- and post-UVC labels, respectively, and gave the same results. The middle and lower panels show the average post-UV length (mean ± SD, t-test, *: P < 0.05) and the proportion of replication signals with post-UV length shorter than 30% of the corresponding pre-UV length (mean ± SD, ordinary two-way ANOVA followed by Sidak's multiple comparisons test, **P < 0.01, ***P < 0.001) for these two experiments, respectively. (C) Upper panel: kinetics of recruitment of RPA70 on chromatin after UVC (25 J m–2) in XPV and XPVpolη cells upon PrimPol depletion (N = 3). Lower panel: WCEs were used to confirm the efficiency of PrimPol depletion. (D) Relative uncoupled forks and distribution of ssDNA lengths at the elongation point in irradiated XPV cells following PrimPol depletion. (E) Relative gapped forks and distribution of gap lengths in irradiated XPV cells following PrimPol depletion. At least 50 forks were characterized in two independent experiments. Histograms are the mean ± SD of the two experiments (one sample t-test, ns: not significant, *P < 0.05). ssDNA length distributions are pools of the two experiments (dot plot with median and interquartile range).

