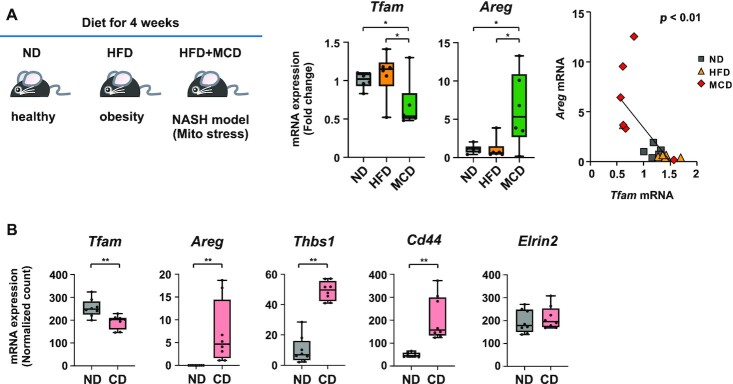
Figure 2.
Tfam downregulation and Areg upregulation in mouse liver tissues under mitochondrial stresses in vivo. (A) Diet-induced murine NASH model corresponding to mitochondrial stresses. Seven-week-old male C57BL/6J mice were fed with normal diet (ND), high-fat diet (HFD) and HFD in combination with methionine and choline deficiency (MCD) for 4 weeks. RT-qPCR analysis of Tfam and Areg mRNAs from liver sections (n = 6). Box plot data are shown by the median and minimum/maximum whiskers. Inverse correlation between Tfam and Areg expression in the MCD group (right). Pearson product-moment correlation coefficient and P values are indicated. (B) Expression of mitochondrial stress-related genes such as Tfam, Areg, Thbs1 and Cd44 in L-amino acid-defined HFD/choline deficiency (CD)-fed mice that had moderate liver injury (n = 8). Data are from GSE137449; *P < 0.05, **P < 0.01.

