Figure 3.
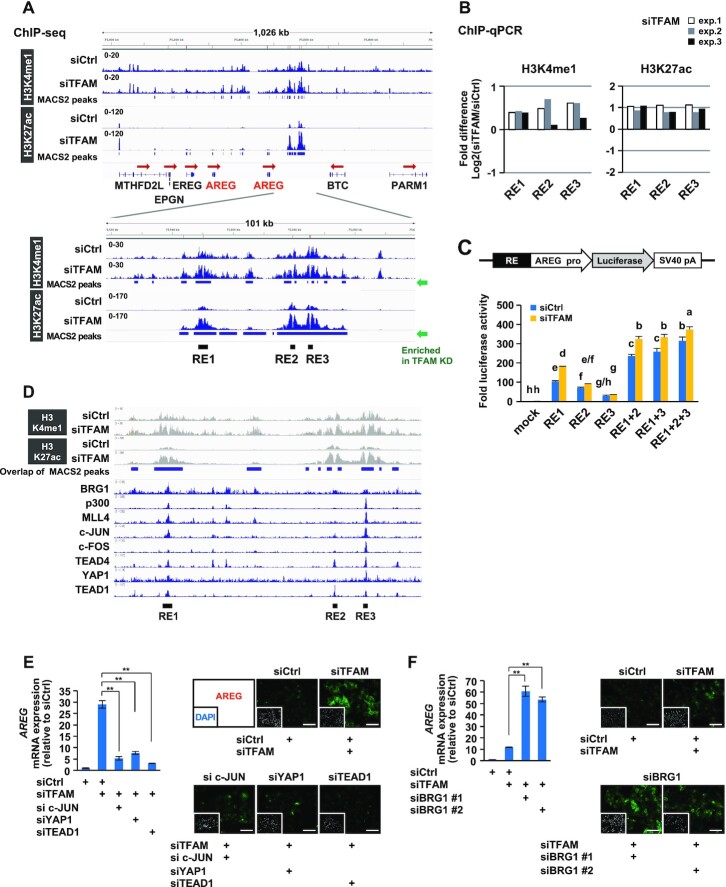
Epigenomic analyses reveal multiple transcriptional regulators acting on AREG gene enhancers under mitochondrial stress. (A) ChIP-seq analyses of active enhancer marks (H3K4me1 and H3K27ac) in HepG2 cells. After TFAM-KD for 72 h, enhancer marks-enriched sites were found between AREG and betacellulin (BTC) genes, named as RE1, RE2 and RE3. (B) Verification of H3K4me1 and H3K27ac enrichments at RE sites. Three independent ChIP-qPCR analyses were conducted under conditions similar to those in (A). The bars indicate the relative changes of modified histones (TFAM-KD versus control-KD) on a log2 scale. (C) Enhancer activity assay of single or multiple combinations of RE fused to AREG promoter-driven luciferase gene. Control and TFAM-KD HepG2 cells were analyzed 48 h after reporter plasmid transfection (n = 3). Differences in letters above the bars (a-h) indicate significant differences (Tukey’s HSD test, P < 0.05). (D) ChIP-Atlas analysis of transcriptional regulators at mitochondrial stress-responsive RE enhancers. The datasets were extracted from the top-ranked fold enrichment (Supplementary Table S4). The ChIP-seq data are from GSM1835989 for BRG1, GSM1240110 for p300, GSM1240109 for MLL4, GSM1700784 for c-JUN, GSM777644 for c-FOS, GSM1010772 for TEAD4, GSM1614029 for YAP1 and GSM1667161 for TEAD1. (E, F) Knockdown effects of RE-associated transcriptional regulators on AREG induction by TFAM depletion. RT-qPCR and immunofluorescence analyses were performed using indicated combinations of siRNAs against TFAM and each factor for 72 h in HepG2 cells; scale bar: 100 μm; **P < 0.01.

