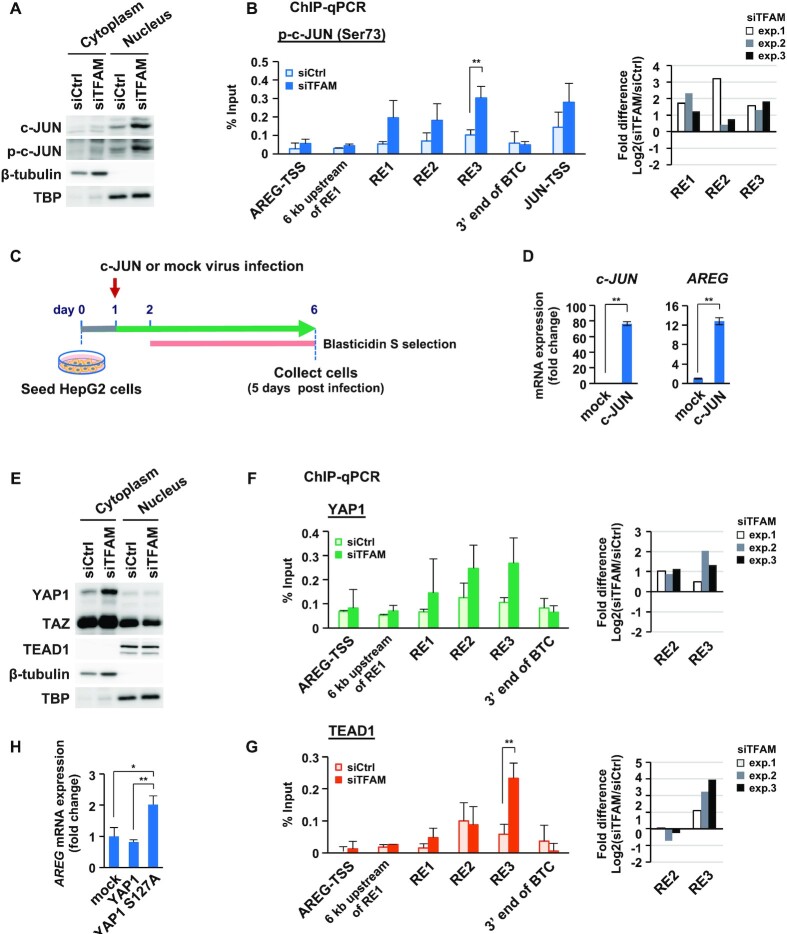
Figure 4.
c-JUN and activated YAP1/TEAD1 induce AREG expression under mitochondrial stress. (A) Western blot analysis of c-JUN and p-c-JUN (phosphorylated c-JUN at Ser73) in cytoplasmic and nuclear fractions from HepG2 cells (control and TFAM-KD for 72 h). (B) ChIP-qPCR analysis of p-c-JUN at RE sites in the AREG gene region. Control and TFAM-KD cells for 72 h were tested (n = 3). Transcription start sites (TSSs) of AREG and JUN genes were used as negative and positive controls, respectively (left). Data are represented as mean ± SD. ** P < 0.01. Based on Supplementary Table S5, fold difference bars indicate the relative enrichments of p-c-JUN for the three REs (TFAM-KD vs. control-KD) on a log2 scale (right). (C) Overexpression of c-JUN using lentivirus gene transfer and blasticidin S selection in HepG2 cells. Representative images of mock and c-JUN-expressing virus infected cells (day 7) (Supplementary Figure S4B). (D) Expression of c-JUN and AREG in c-JUN overexpressing cells (n = 3); ** P < 0.01, *P< 0.05. (E) Western blot analysis of YAP1, TAZ, and TEAD1 in cytoplasmic and nuclear fractions from HepG2 cells (control and TFAM-KD for 72 h). (F, G) ChIP-qPCR analysis of YAP1 (F) and TEAD1 (G) at RE sites in the AREG gene region. Control and TFAM-KD cells for 72 h were tested (n = 3). TSS of AREG gene and other sites were used as negative controls (left). Data are represented as mean ± SD. **P < 0.01. Based on Supplementary Table S5, fold difference bars indicate the relative enrichments of YAP1 and TEAD1 at RE2/3 enhancers (TFAM-KD versus control-KD) on a log2 scale (right). (H) RT-qPCR analysis of AReG mRNA; n = 3, **P < 0.01, *P < 0.05.

