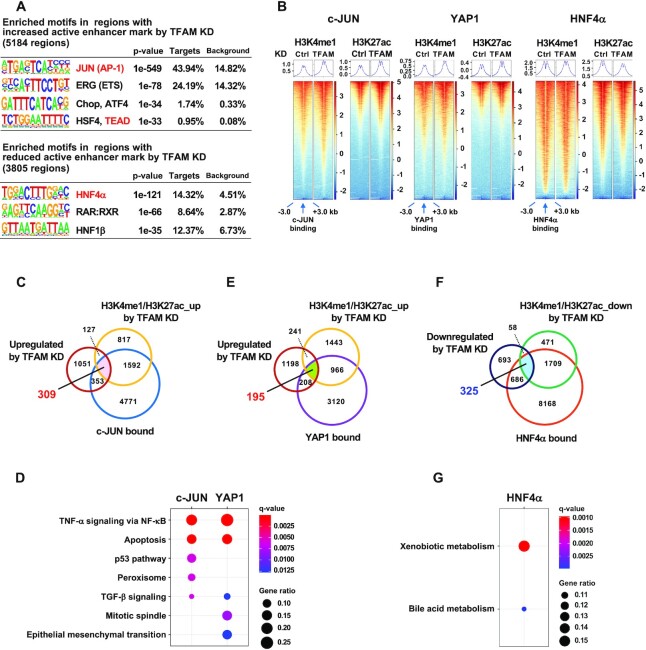
Figure 6.
Genome-wide gene regulation mediated by c-JUN, YAP1 and HNF4α under mitochondrial stress. (A) Enriched motifs in the regions with increased or decreased enhancer marks (H3K4me1 and H3K27ac) in TFAM depleted-HepG2 cells. Motifs for transcription factor binding were identified using the HOMER algorithm. (B) Enhancer marks near c-JUN, YAP1 or HNF4α binding sites (–3 to + 3 kb) in control and TFAM-KD cells. Normalized enrichment values are from GSM1700784 for c-JUN, GSM1614029 for YAP1 and GSM469863 for HNF4α. (C,E) Venn diagram of 309 genes merged with transcriptional upregulation (≥1.5-fold in TFAM-KD), increased enhancer marks by TFAM-KD and c-JUN binding (C), and 195 genes merged with transcriptional upregulation (≥1.5-fold in TFAM-KD), increased enhancer marks by TFAM-KD and YAP1 binding (E) (listed in Supplementary Table S6). (D) Top five Molecular Signatures Database (MSigDB) Hallmark pathways enriched in 309 c-JUN target genes (C) and 195 YAP1 target genes (E). The gene ratios of Peroxisome and TGF-β signaling in c-JUN targets and TGF-β signaling in YAP1 targets were 0.08, 0.05 and 0.06, respectively. FDR < 0.05. (F) Venn diagram of 325 genes merged with transcriptional downregulation (≥1.5-fold in TFAM-KD), decreased enhancer marks by TFAM-KD, and HNF4α binding (listed in Supplementary Table S6). (G) The MSigDB Hallmark pathways enriched in 325 overlapped genes (F). The gene ratios for Xenobiotic metabolism and Bile acid metabolism were 0.16 and 0.10, respectively; FDR < 0.05.

