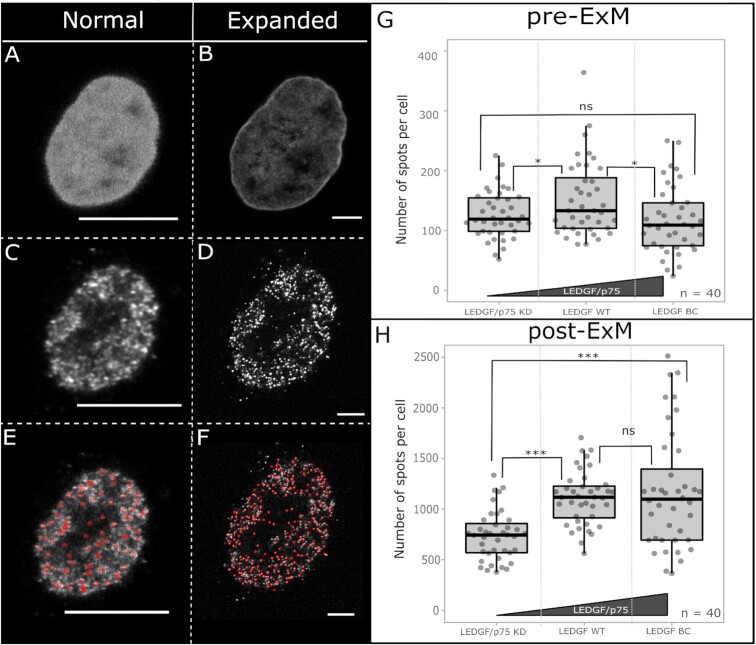
Figure 2.
Imaging of the same HeLaP4 cell before (A, C, E) and after (B, D, E) expansion. Quantification of LEDGF in HeLaP4 cells with WT levels of LEDGF (p75 and p52) (LEDGF WT), with reduced p75 levels (LEDGF/p75 KD) and in LEDGF KD back complemented cells (LEDGF BC). (A, B) DAPI staining for segmentation of the nucleus and identification of cells pre- and post-expansion. Due to improved resolution after expansion, the DAPI staining appears less homogenous, corresponding with the distribution of the chromatin (30). (C, D) Immunostaining of LEDGF/p75 and p52 proteins before and after expansion; secondary antibody: GAM Alexa488 (4 μg/ml). (E, F) MATLAB routine output with red circles indicating what is counted as a spot. (G, H) Box plots showing quantification of counted spots both pre-ExM and post-ExM in HeLaP4 cells with varying LEDGF/p75 expression, where each grey dot represents one cell. The polyclonal nature of LEDGF BC cells results in a strong variation in expression levels post-ExM (H). The used primary antibody (2 μg/ml) targets both LEDGF/p75 and LEDGF/p52 proteins. Statistical analysis was performed by a One-way ANOVA: ns) non-significant; *P-value < 0.05; ***P-value <0.001; number of cells (n) = 40, with two different samples analyzed per condition. The presented images (A–F) are single optical sections. Scale bars: 10 μm (A–F). Details on used antibodies and dilutions can be found in SI Table 11.

