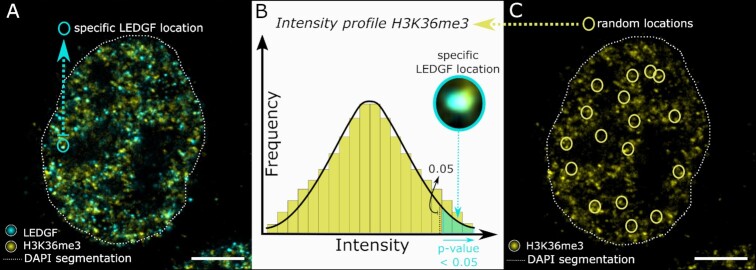
Figure 3.
Schematic illustration of the concept of co-localization analysis. (A) Nuclear segmentation is indicated by the dotted white line. Inside the nucleus of a HeLaP4 cell, both the LEDGF protein (cyan) and H3K36me3 marker (yellow) are shown via immunostaining, with indication of the location of a specific LEDGF spot circled in cyan. (B) A zoom of this specific LEDGF location is shown and the corresponding H3K36me3 intensity at this exact location is plotted onto the overall intensity profile of H3K36me3 to calculate a P-value. If such a P-value is found to be lower than 0.05, co-localization is considered to occur. (C) Random locations (yellow circles) in the marker channel of the same cell as shown in (A) are used to generate a distribution of intensity values as shown in (B). The presented images (A, C) are single optical sections. Scale bars: 10 μm (A, C). Details on used antibodies and dilutions can be found in SI Table 11.

