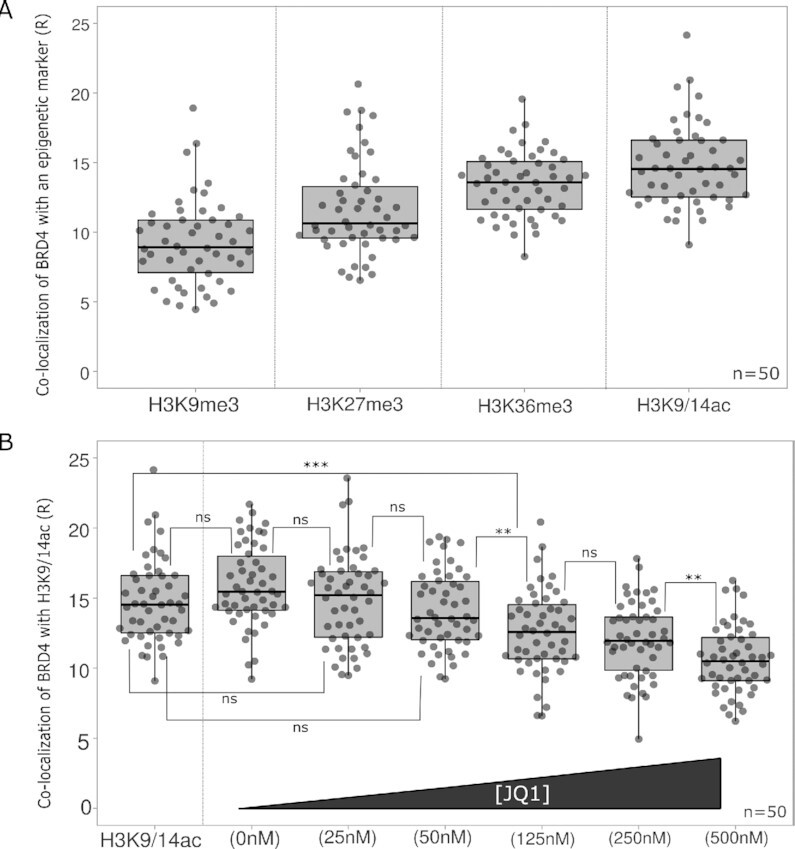
Figure 5.

Co-localization of BRD4 with different epigenetic modifications and inhibition by JQ1. (A) Co-localization of BRD4 with H3K9me3, H3K27me3, H3K36me3 or H3K9/14ac marks. Co-localization was measured in HeLaP4 cells. (B) Co-localization of BRD4 with H3K9/14ac in the presence of an increasing JQ1 concentration: 0, 25, 50, 125, 250 and 500 nM. Statistical analysis was performed by a one-way ANOVA: (ns) non-significant; **P-value < 0.01; ***P-value < 0.001; number of cells (n) = 50 with each grey dot representing one cell and two different samples analyzed per condition. Co-localization analysis was performed on Z-stacks of expanded cells consisting of 9–11 Z-slices with a Z-step size of 0.2 μm.
