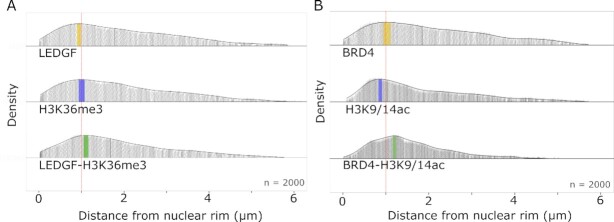
Figure 6.
Spatial organization of epigenetic readers and histone marks in HeLaP4 cells. (A) Density plots for the distance (μm) of LEDGF, H3K36me3 and co-localizing spots to the nuclear rim. The median distance is presented as a thin black line inside the density plot: LEDGF = 1.75 μm; H3K36me3 = 1.71 μm; LEDGF – H3K36me3 = 1.64 μm. The region with the highest density is colored for each plot: LEDGF in yellow ∼0.9 μm; H3K36me3 in blue ∼1.0 μm; LEDGF – H3K36me3 in green ∼1.15 μm. (B) Density plots for the distance (μm) of BRD4, H3K9/14ac and co-localizing spots to the nuclear rim. The median distance is presented as a thin black line inside the density plot: BRD4 = 1.80 μm; H3K9/14ac = 1.48 μm; BRD4 – H3K9/14ac = 1.39 μm. The region with the highest density is colored for each plot: BRD4 in yellow ∼ 1.1 μm; H3K9/14ac in blue ∼ 0.8 μm; BRD4 – H3K9/14ac in green ∼ 1.25 μm. The red dotted line inside the density plot represents a distance of 1.0 μm. The average radius of a HeLaP4 nucleus is 6.00 ± 0.69 μm. Number of analyzed spots (n) = 2000 with each grey dot representing one spot (protein, marker or co-localizing protein). The spatial analysis was performed on Z-stacks of expanded cells consisting of 9–11 Z-slices with a Z-step size of 0.2 μm.

