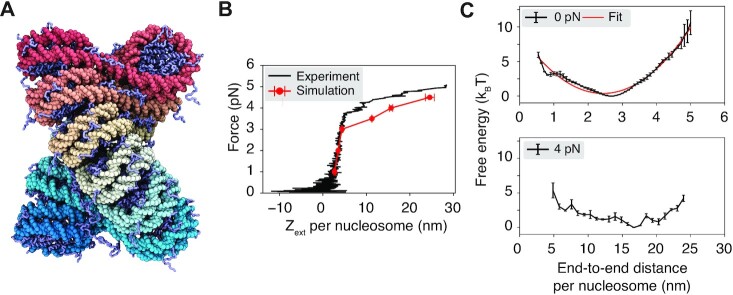
Figure 1.
Coarse-grained modeling reproduces the force–extension curve for chromatin. (A) Illustration of the two-helix fibril chromatin structure with a linker length of 20 bp. The DNA molecule varies from red to cyan across the two ends, and histone proteins are drawn in ice blue. (B) Comparison between the simulated (red) and experimental (52) (black) force–extension curve. (C) Free energy profiles as a function of the DNA end-to-end distance per nucleosome computed with the presence of 0 pN (top) and 4 pN (bottom) extension force. A harmonic fit to the 0 pN simulation result is shown in red. Error bars correspond to the standard deviation of the mean estimated via block averaging by dividing simulation trajectories into three independent blocks of equal length.

