
Figure 2.
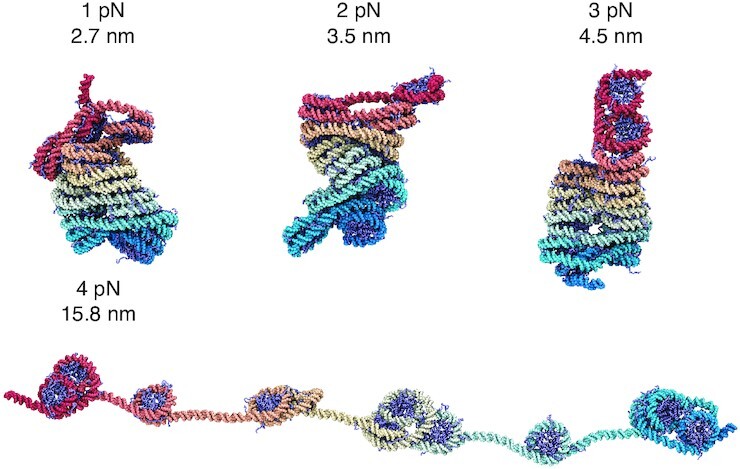
Representative chromatin structures from simulations performed under various extension forces (also see Supplementary Figure S9). The values for the extension force and the end-to-end distance per nucleosome are provided next to the structures. The same coloring scheme as in Figure 1 A is adopted here.