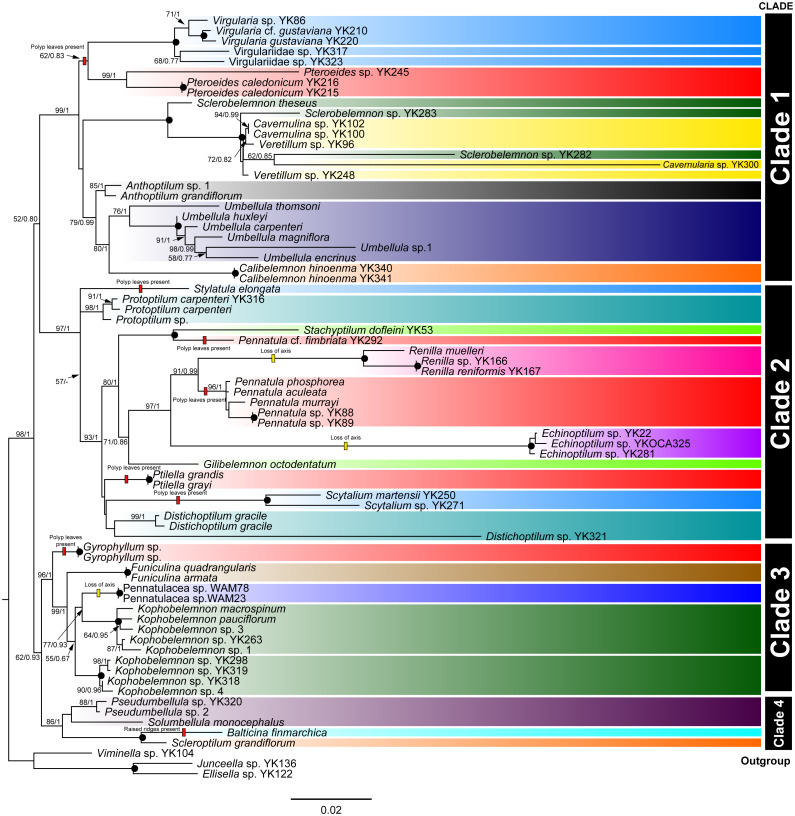
Figure 1. COI+mtMutS+ND2 phylogenetic tree constructed by ML method.
The numbers on each branch indicate the ML/B = bootstrap values/posterior probabilities. The black circles on each node indicate the ML/B = 100/1.00. Each color indicates each family; light blue: Virgulariidae, red: Pennatulidae, green: Kophobelemnidae, yellow: Veretillidae, black: Anthoptilidae, dark navy: Umbellulidae, orange: Scleroptilidae, blue green: Protoptilidae, yellow green: Stachyptilidae, pink: Renillidae, light purple: Echinoptilidae, brown: Funiculinidae, Dark purple: Pseudumbellulidae, light blue green: Balticinidae, blue: Pennatulacea sp. The bars at the right side show clades. The small boxes on branches indicate events estimated by maximum parsimony methods; yellow: loss of axis, red: polyp leaves or raised ridges present. Scale indicates substitutions per site.

