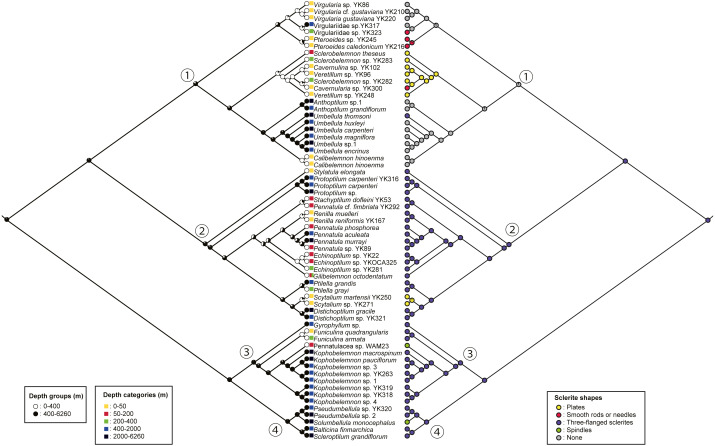
Figure 5. Ancestral state reconstruction for habitat depth by ML method.
Monochrome circle color in the left tree indicates each depth group; white: the shallower group (0–400 m), black: the deeper group (400–6260 m) and each box’s color each depth categories; yellow: shallow (0–50 m), red: mesophotic (50–200 m), green: shallower deep (200–400 m), blue: medium deep (400–2000 m), and black: deep (2000–6260 m). Circle colors in the right tree indicate each shape of sclerites in the rachis; gray: none, yellow: plates, red: smooth rods or needles, blue: three-flanged sclerites, yellow green: spindles. Each number in a circle indicates each clade.

