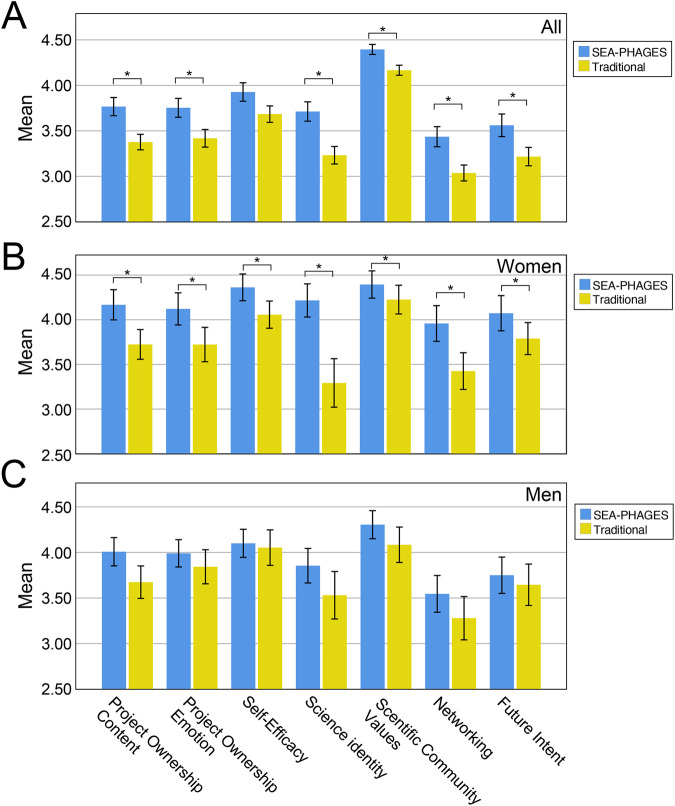
FIGURE 2.
Bar graph comparison of SEA-PHAGES and traditional students (blue and yellow bars, respectively) on the PITS survey variables and future intent to persist in the sciences. (A) Course comparison for SEA-PHAGES and traditional laboratory. (B) Disaggregated course comparison (SEA-PHAGES and traditional lab) for women. (C) Disaggregated course comparison (SEA-PHAGES and traditional lab) for men. Equally sized random student groups by course type were propensity score matched and compared on average treatment effect on the treated (ATET). Significant differences following a Holm-Bonferroni correction are indicated (*p < 0.05). PITS survey ratings are from 1 (strongly agree) to 5 (strongly disagree) for all measures except scientific community values, which had a 1 (not like me at all) to 6 (very much like me); scientific community values rating was proportionally rescaled to 1–5 for this figure.

