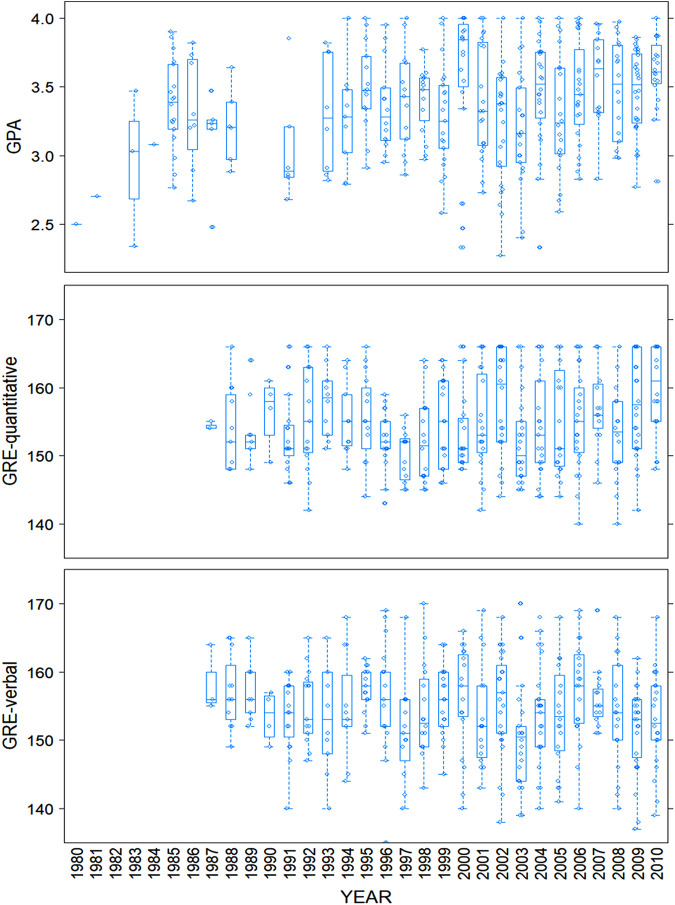
FIGURE 3.
Year-by-year enrollment metrics of the TAMU-BCBP PhD program. GPA (top panel), GRE-Q (middle panel), and GRE-V (bottom panel) values are on the y-axis for each student enrolled in the year shown on the x-axis. The crossbar in each box represents the median. The whiskers of each box were drawn at 1.5 times the interquartile range.

