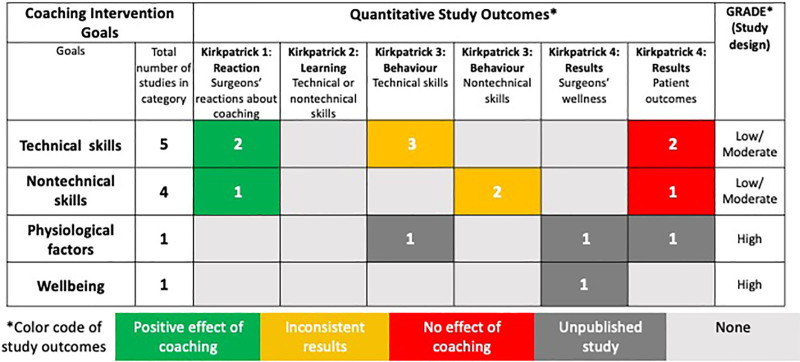
FIGURE 2.
Research gaps diagram classifying studies by coaching goal, outcome, design GRADE, and findings. Study findings are represented by colors. Green represents positive findings, yellow mixed findings, and red negative findings. Dark gray represents outcomes of trials that have not been published yet. Light gray represents outcomes that were not evaluated by any of the studies included in the review. We used an adapted Kirkpatrick model to categorize the studies’ outcomes. Outcomes related to surgeons’ reactions to the coaching intervention or coaching in general were classified as Kirkpatrick level 1. Outcomes measuring technical or nontechnical skills, knowledge, or attitudes in a simulated environment were considered Kirkpatrick level 2. Outcomes measuring technical or nontechnical skill or changes in behavior measured in the operating room or in real life were classified as Kirkpatrick level 3. Patient outcomes or surgeon-centered outcomes were classified as Kirkpatrick level 4. We used an approach inspired by the GRADE system to to classify evidence levels based on intervention study designs. Randomized trials were considered “high,” quasi-experimental studies with contemporaneous controls were categorized as “moderate” and without controls as “low.”

