Figure 3.

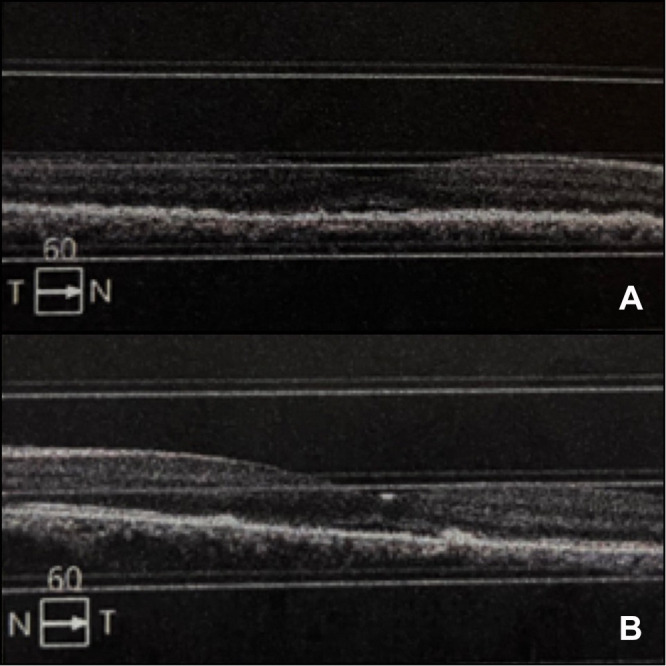
Optical coherence tomography (OCT) indicates minimal subretinal fluid in the right eye (A), minimal subretinal fluid and localized retinal pigment epithelium disruption in the left eye (B).

Optical coherence tomography (OCT) indicates minimal subretinal fluid in the right eye (A), minimal subretinal fluid and localized retinal pigment epithelium disruption in the left eye (B).