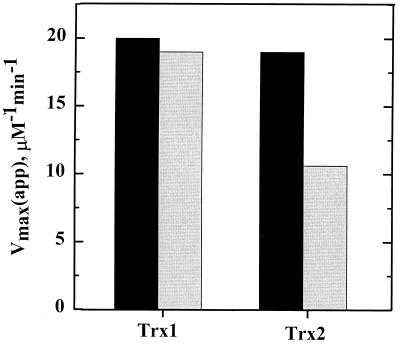
FIG. 2.
Comparative kinetic parameters of Trx1 and Trx2 from H. pylori. Trx activity assays using either 200 μM DTNB (black bars) or 80 μM insulin (gray bars) as a substrate for 0 to 50 μM Trx1 or Trx2 were conducted in a standard buffer of 100 mM potassium phosphate and 2 mM EDTA, pH 7.4, with 150 μM NADPH. Assays were started with the addition of 7.0 nM TrxR and were monitored at 340 nm when insulin was used as the substrate or at 412 nm when DTNB was used as the substrate to observe the release of TNB2−. Rates were determined from the first 10% of the reaction and then fitted to a hyperbola to determine the Vmax(app) and Km(app) values for each.

