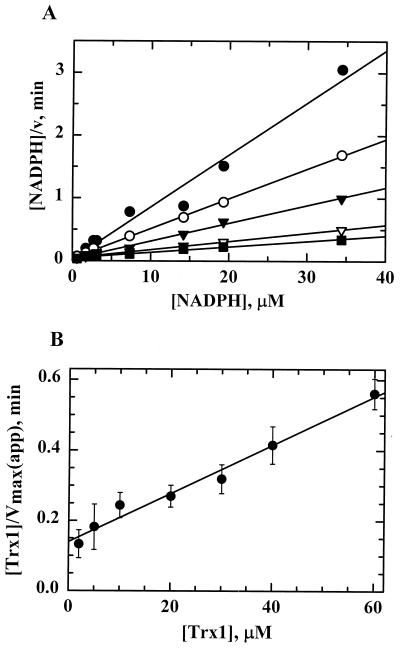
FIG. 3.
Steady-state kinetic analysis of Trx1 and TrxR from H. pylori. Assays were conducted using a stopped-flow spectrophotometer that monitored the decrease in NADPH fluorescence as described in Materials and Methods. NADPH concentrations (0.8 to 34 μM) were varied at fixed concentrations of Trx1 in the presence of 0.1 μM TrxR. (A) Representative primary Hanes-Wolf plot of one set of initial-rate data for 2 μM (closed circles), 5 μM (open circles), 10 μM (closed triangles), 20 μM (open triangles), and 60 μM (closed squares) Trx1. (B) A replot of the averaged data from three separate experiments was used to calculate the steady-state kinetic parameters for H. pylori TrxR as summarized in Table 3.

